
On-site Analytics
On-site campaigns give you two reports. The campaign's Analytics tab shows totals for the whole flow and every channel in it. The On-Site Detailed Report examines a single on-site send: how many messages were displayed, clicked and dismissed, and on which applications and devices this happened.
| You want to... | Use |
|---|---|
| See campaign totals, compare channels in the flow, or follow the trend over time | Campaign Analytics tab |
| See how one on-site send performed: displays, clicks, dismissals, applications and devices | On-Site Detailed Report |
Campaign Analytics Tab
How to Access
- Go to Campaign > Flows and select the One Time or Recurring tab.
- Click the three dots at the end of the campaign row and select Flow/Analytics. You can also click the campaign name and then open the Analytics tab.
For recurring campaigns, select the Job Version, set the Date Range, and press the Report button to generate the report.
What It Shows
The Analytics view displays Total Sent split into Contacts and Anonymous users, next to the campaign's Opens and Clicks; a Channel Comparison row with Sends, Delivered and Engagements for each channel in the flow; a Sends table with one row per send showing Send Name, Channel, Audience, Delivered, Opens and Clicks, together with a Percent or Number view and a column selector; and a Performance chart that switches between Delivered and Engagement trends on a daily, weekly or monthly basis. For On-Site sends, these figures are calculated from display and click signals.
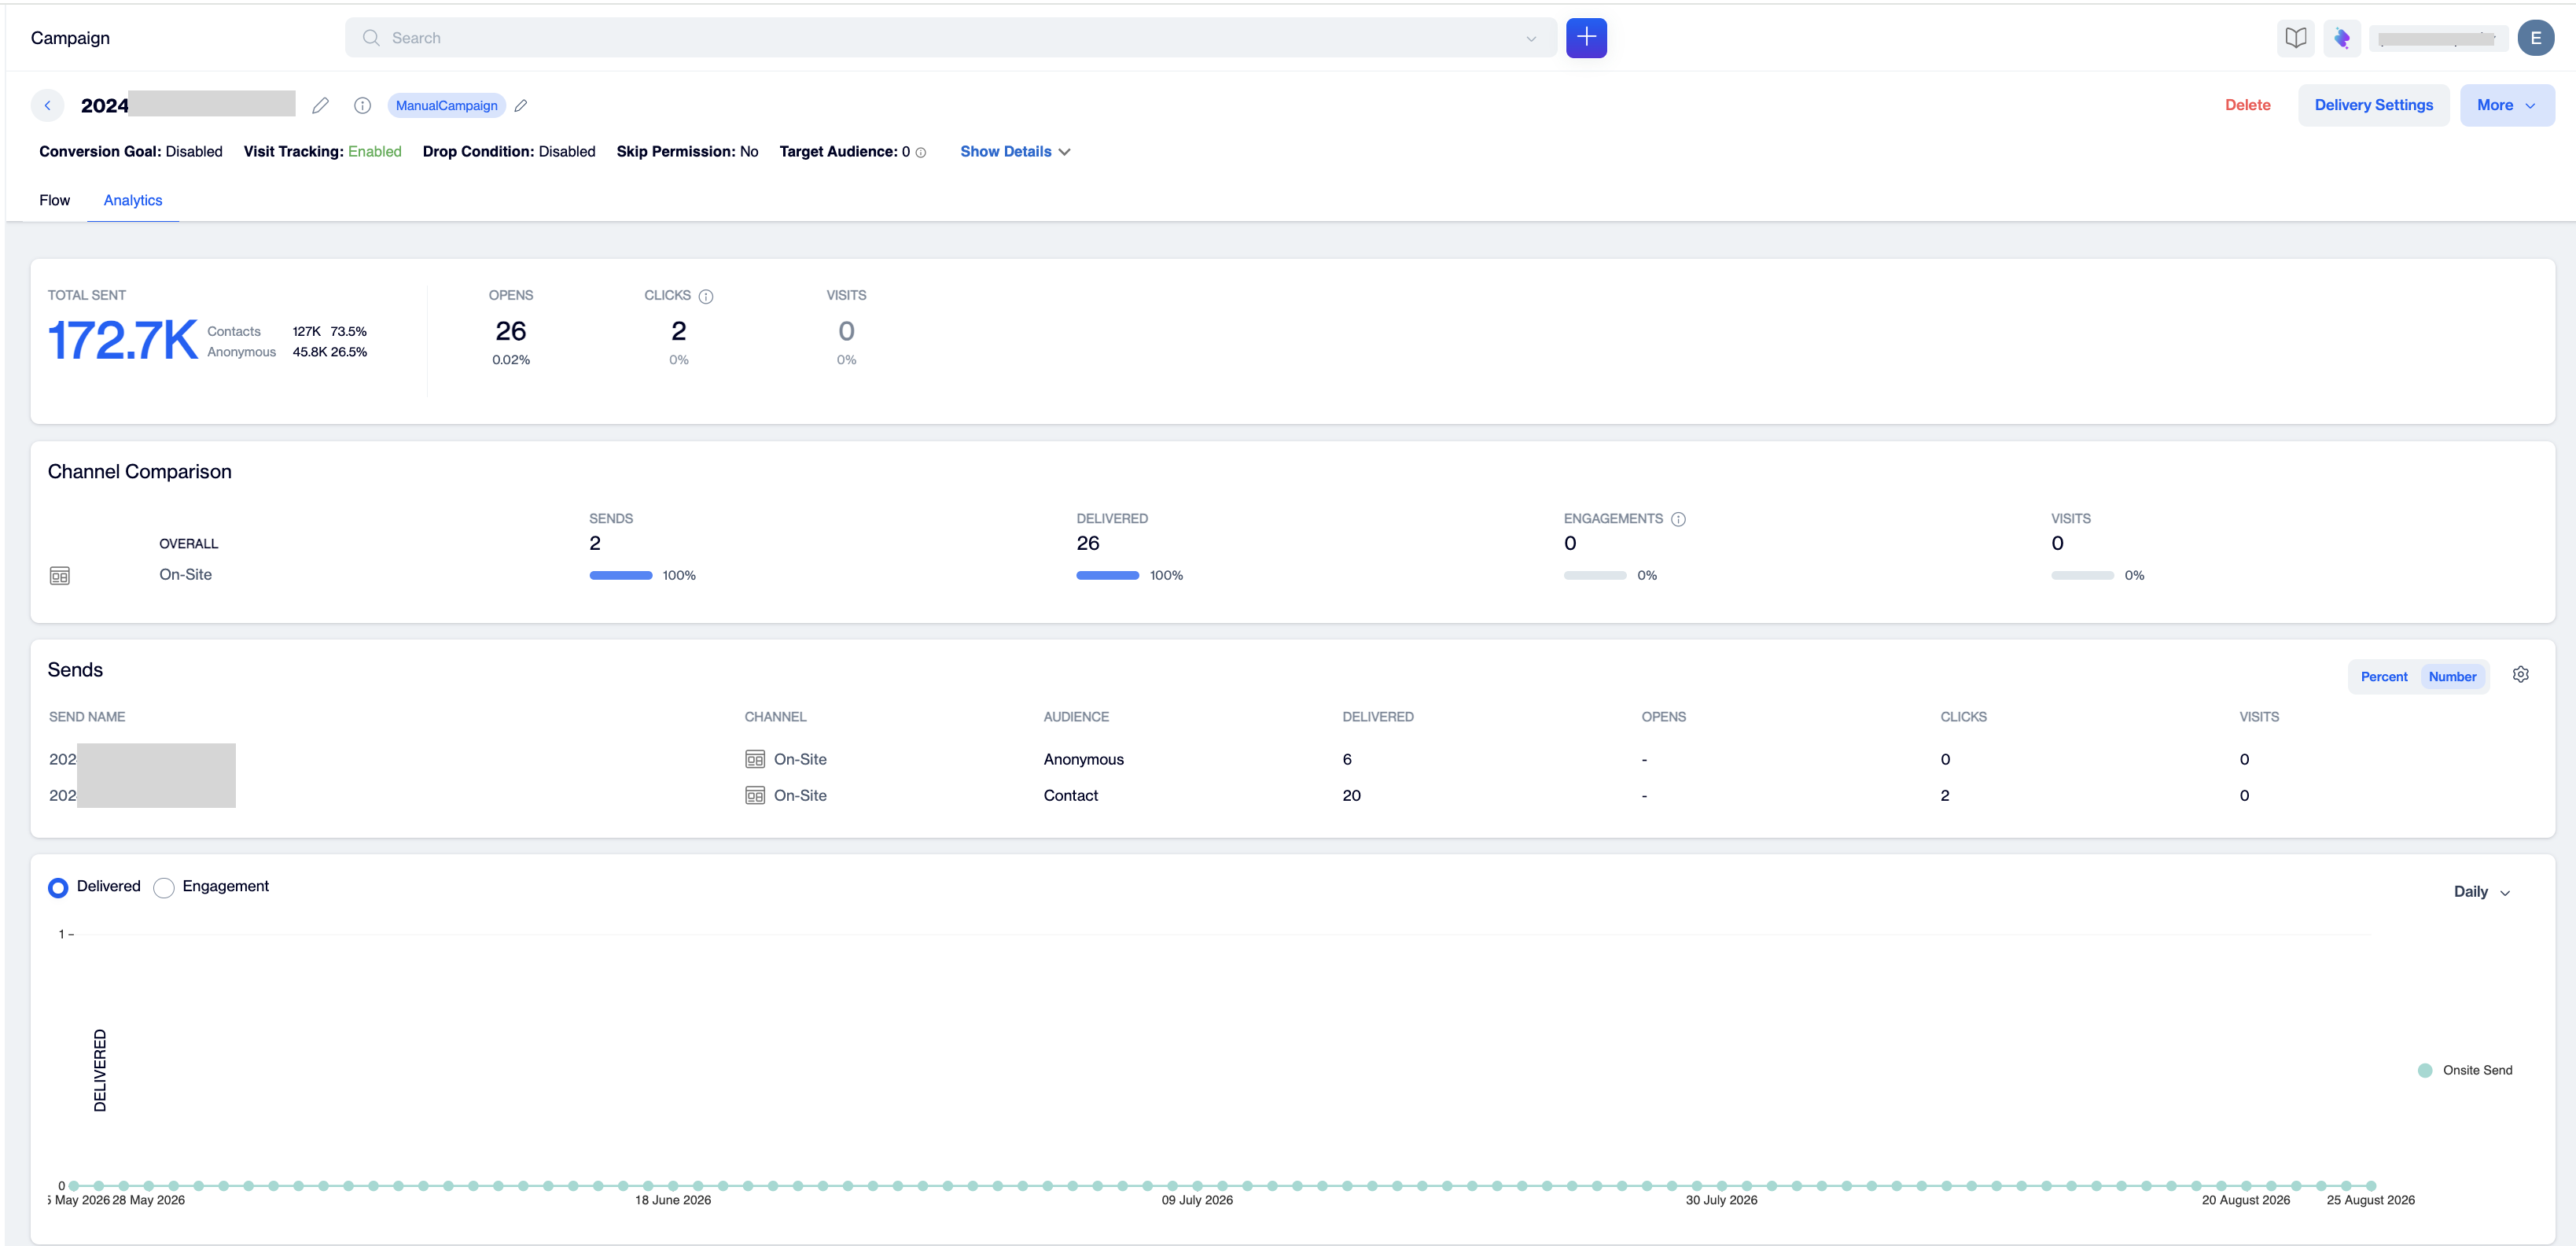
Campaign Analytics tab for an on-site campaign
On-Site Detailed Report
How to Access
- Open the campaign flow.
- Click the Send On-Site node. A summary popover shows the template name with a preview option, the start and end times, and the Sent, Displayed, Click and Dismissed counts.
- Select View report.
The report header shows the campaign name, the send status, the Total Targeted count, and the Public ID and Cancel Messages buttons. The report is organized into two tabs: Summary and Clients.
Summary Tab
The top of the tab presents the send in cards:
- Content: a preview of the template, the Send Name, the Applications where the message can appear, and Tags.
- Total Message: the number of messages processed for the send. The Unsent line expands with more to break unsent messages into Excluded and Has Error.
- Displayed: total and unique displays, with the display rate.
- Clicks: total and unique clicks, with the click rate.
- Dismissed: total and unique dismissals, with their rate.
Below the cards, Clicks By Device splits clicks into Mobile Phone, Tablet, Desktop and Unknown, and the On-Site Send Performance funnel tracks the send from Total Message to Display to Click, with the Display Rate and Click Rate shown next to it.
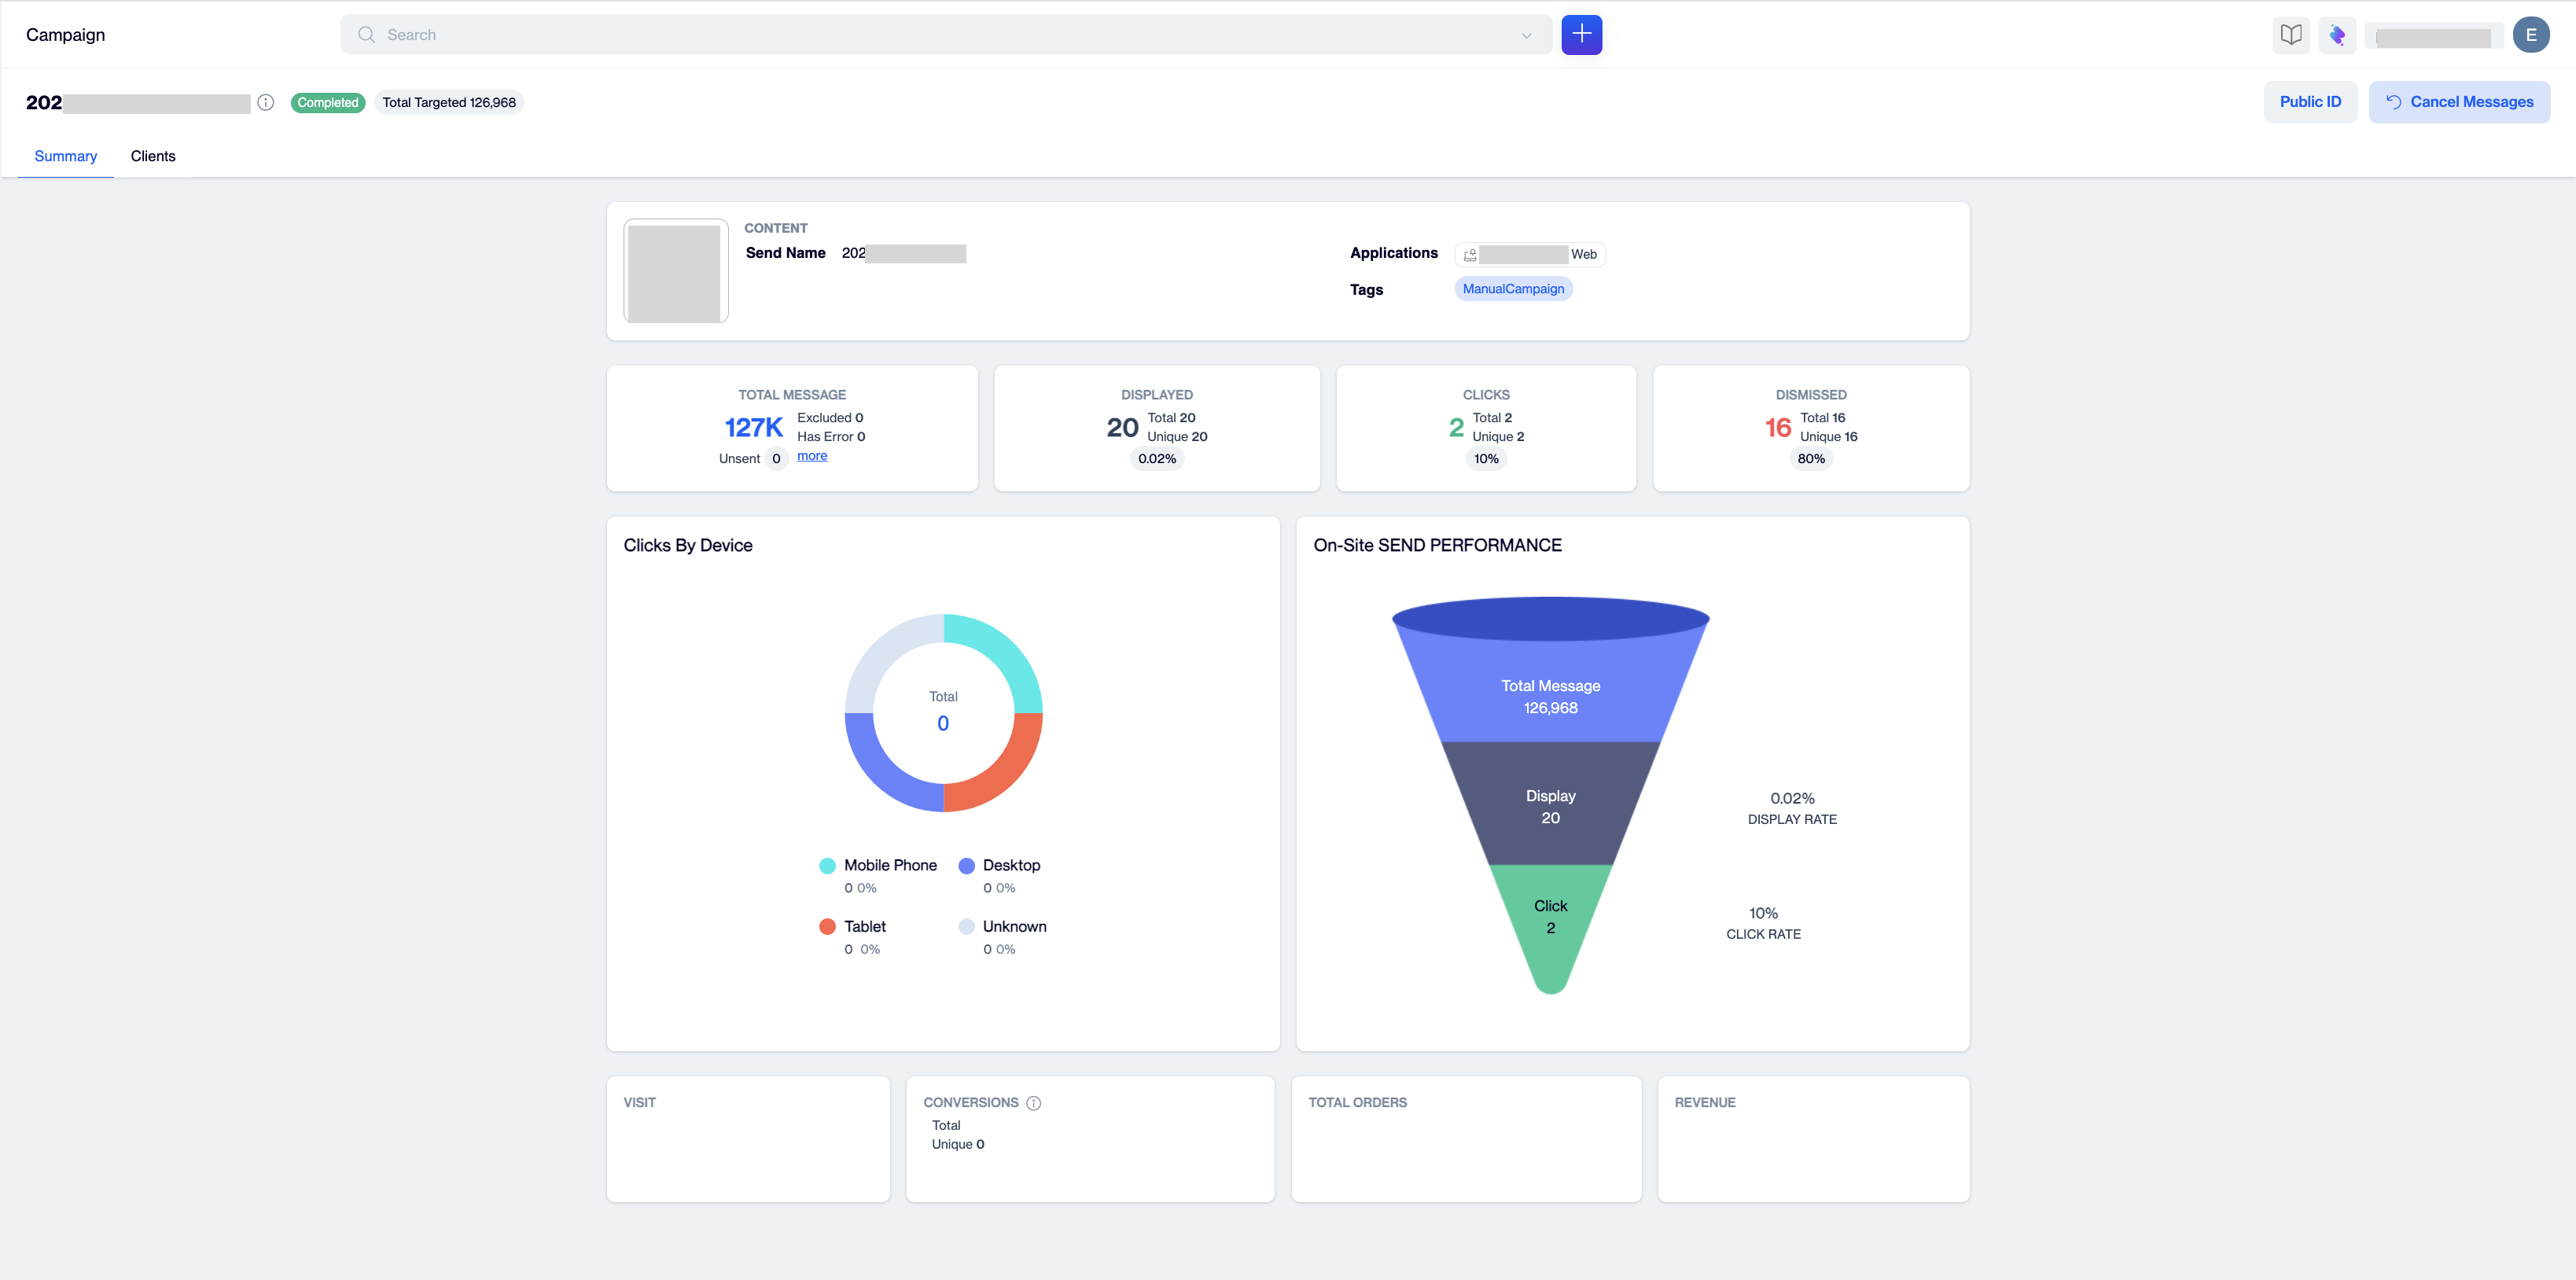
Summary tab with the four metric cards, Clicks By Device chart, and On-Site Send Performance funnel.
Clients Tab
The Clients tab breaks displays and clicks down by environment. Each block pairs a table of Displayed Count and Click Count with a comparison chart:
- Applications: every connected website or application where the send could appear.
- Device Types: Desktop, Mobile Phone and Tablet.
- Operating System: the operating systems of the devices that displayed the message.
- Device Brands: the brands of those devices.
These breakdowns are generated from displayed and click signals coming from the device. A block shows No information found when the collected signals do not include that detail.
TipAn application with many displays but few clicks may need a different message, position or design for that audience.
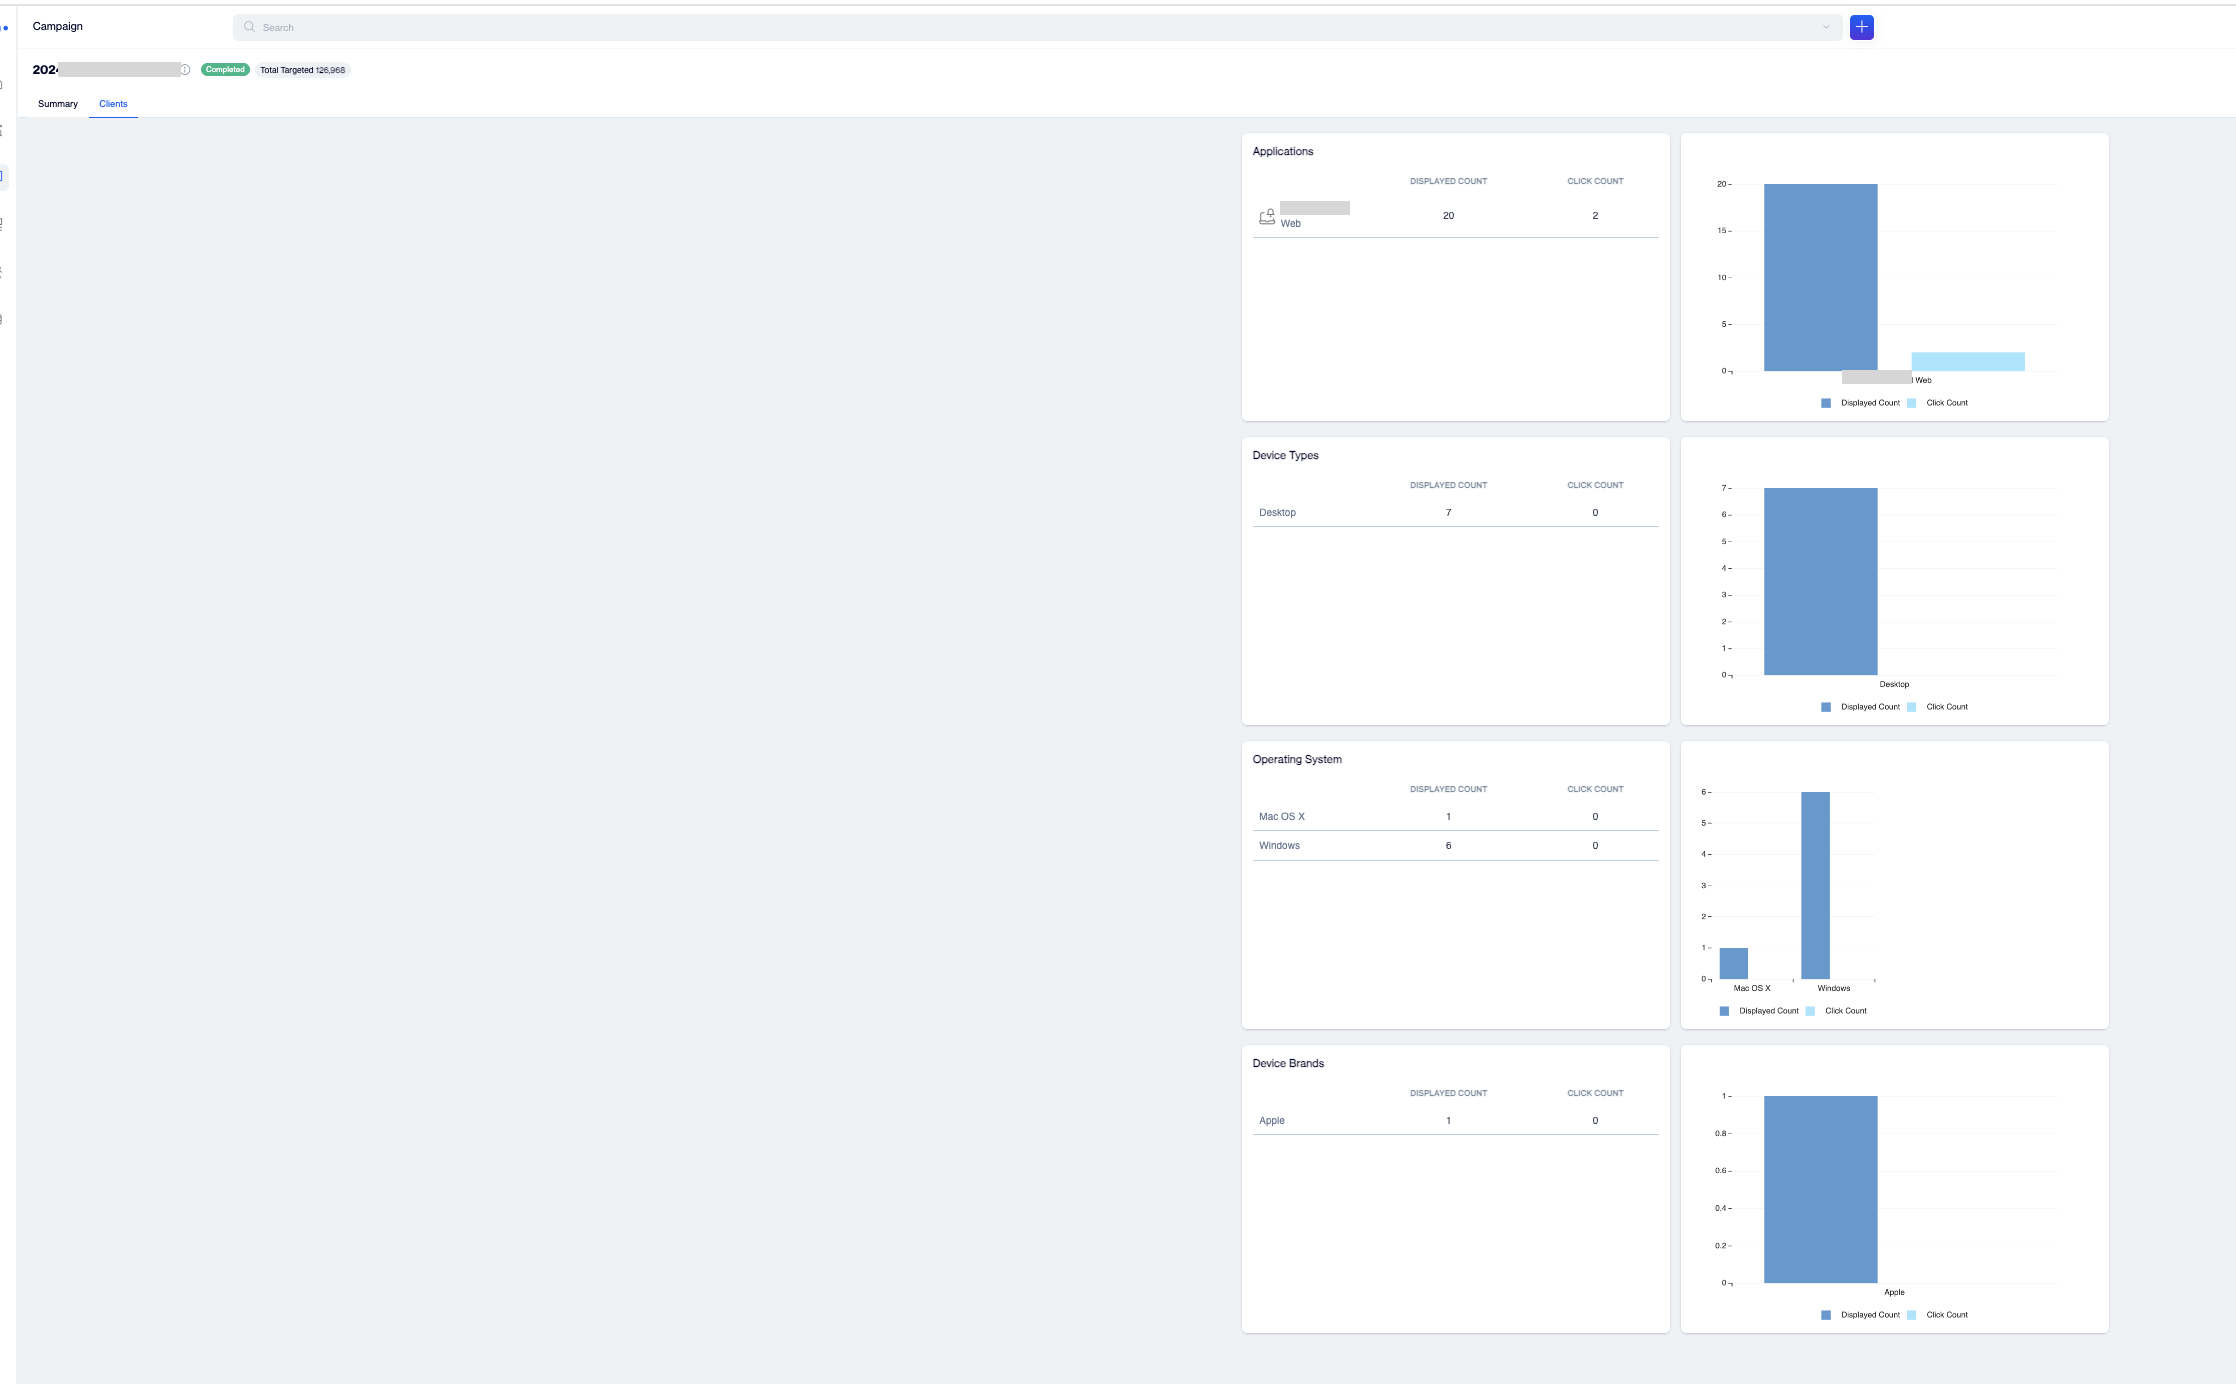
Clients tab
Metrics Reference
| Metric | Definition |
|---|---|
| Total Targeted | The number of people targeted by the send, shown in the report header. |
| Total Message | Messages processed for the send. The Unsent breakdown shows Excluded and Has Error counts. |
| Sent | Messages sent toward the target audience for the node, shown in the flow popover. |
| Displayed / Unique Displayed | The number of times the message was shown; Unique counts one display per person. |
| Display Rate | Displayed / Total Message. |
| Click / Unique Click | Clicks on the message; Unique counts one click per person. |
| Click Rate | Clicks / Displays: the share of displayed messages that were clicked. |
| Dismissed / Unique Dismissed | Messages closed by the viewer; Unique counts one dismissal per person. |
| Contacts / Anonymous | Registered users versus unregistered or unidentified visitors (campaign level Total Sent breakdown). |
| Applications | The connected websites and applications where the on-site message can display. |
| Displayed Count / Click Count | Display and click totals per row in the Clients tab breakdowns. |
Prerequisites
- The report becomes available after the send runs; Displayed, Click and Dismissed metrics populate as signals arrive from your website or application.
- The connected application must include the integration that serves on-site messages, since every metric in this report is calculated from the signals it sends.
- Recurring campaigns require Job Version and Date Range selection before generating the report.
- The Clients tab is calculated from displayed and click signals from the device; a block without matching signals shows No information found.
Updated about 1 month ago