
In-App Analytics
In-app campaigns give you two reports. The campaign's Analytics tab shows totals for the whole flow, covering every send and every channel it uses. The In-App Detailed Report drills into one send and shows how users behaved: displays, clicks, dismissals, button clicks, devices, and applications.
| You want to... | Use |
|---|---|
| See campaign totals, compare channels in the flow, or follow the trend over time | Campaign Analytics tab |
| See how one in-app message performed: displays, clicks, dismissals, button clicks, devices, applications | In-App Detailed Report |
1. Campaign Analytics Tab
How to Access
- Go to Campaign > Flows and select the One Time or Recurring tab.
- Click the three dots at the end of the campaign row and select Flow/Analytics. Alternatively, click the campaign name and then click the Analytics tab.
For recurring campaigns, select the Job Version and set the Date Range, then press the Report button to generate the report.
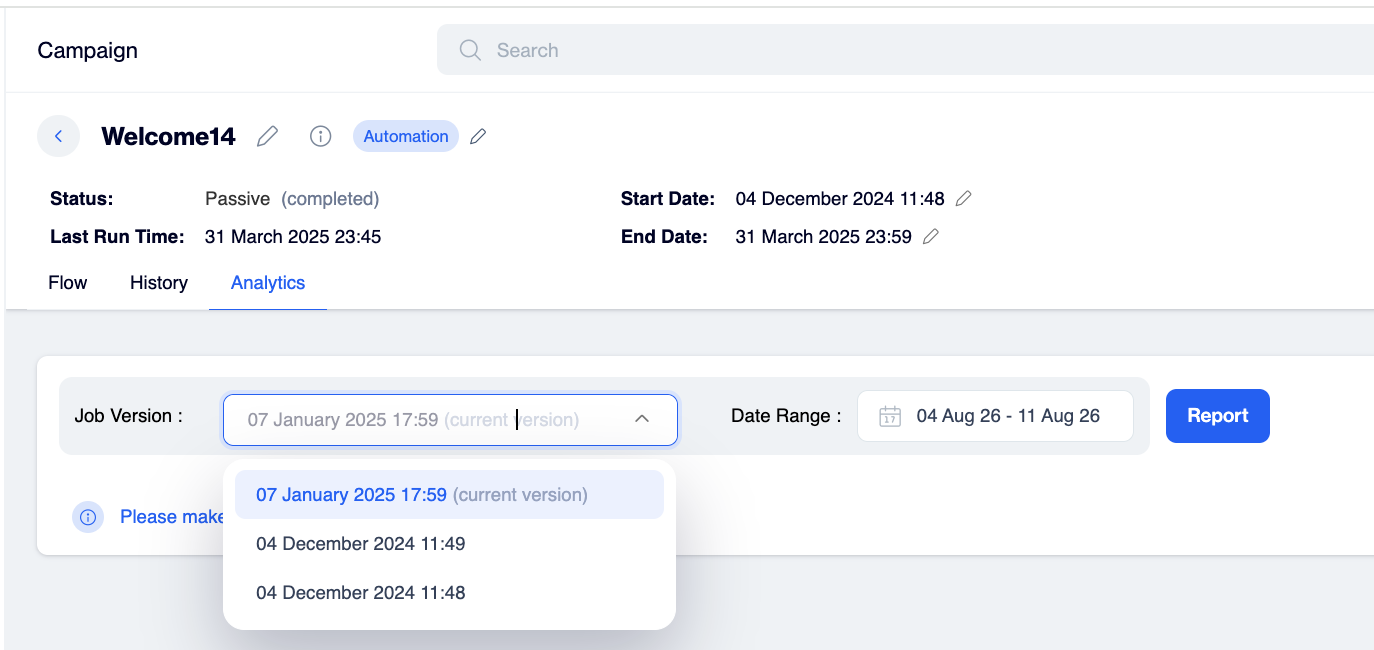
Recurring campaigns > Job version
What It Shows
- Total Sent: All messages sent by the campaign, split into Contacts (registered users) and Anonymous (unregistered or unidentified users), with Opens and Clicks beside it. For in-app sends the campaign-level Opens card is populated: an in-app display counts as an open. In the Sends table below, the per-send Opens column shows "-"; per-send display counts live in the In-App Detailed Report. Hover a card to see its Contacts and Anonymous split.
- Channel Comparison: Sends, Delivered, and Engagements for each channel, so you can compare in-app against the other channels the campaign uses.
- Sends table: One row per send with Send Name, Channel, Audience (Contact or Anonymous), Delivered, Opens, and Clicks. Use the Percent / Number toggle to switch how values display, and the gear icon to configure columns.
- Performance chart: A time chart of Delivered or Engagement, switchable between daily, weekly, and monthly views.
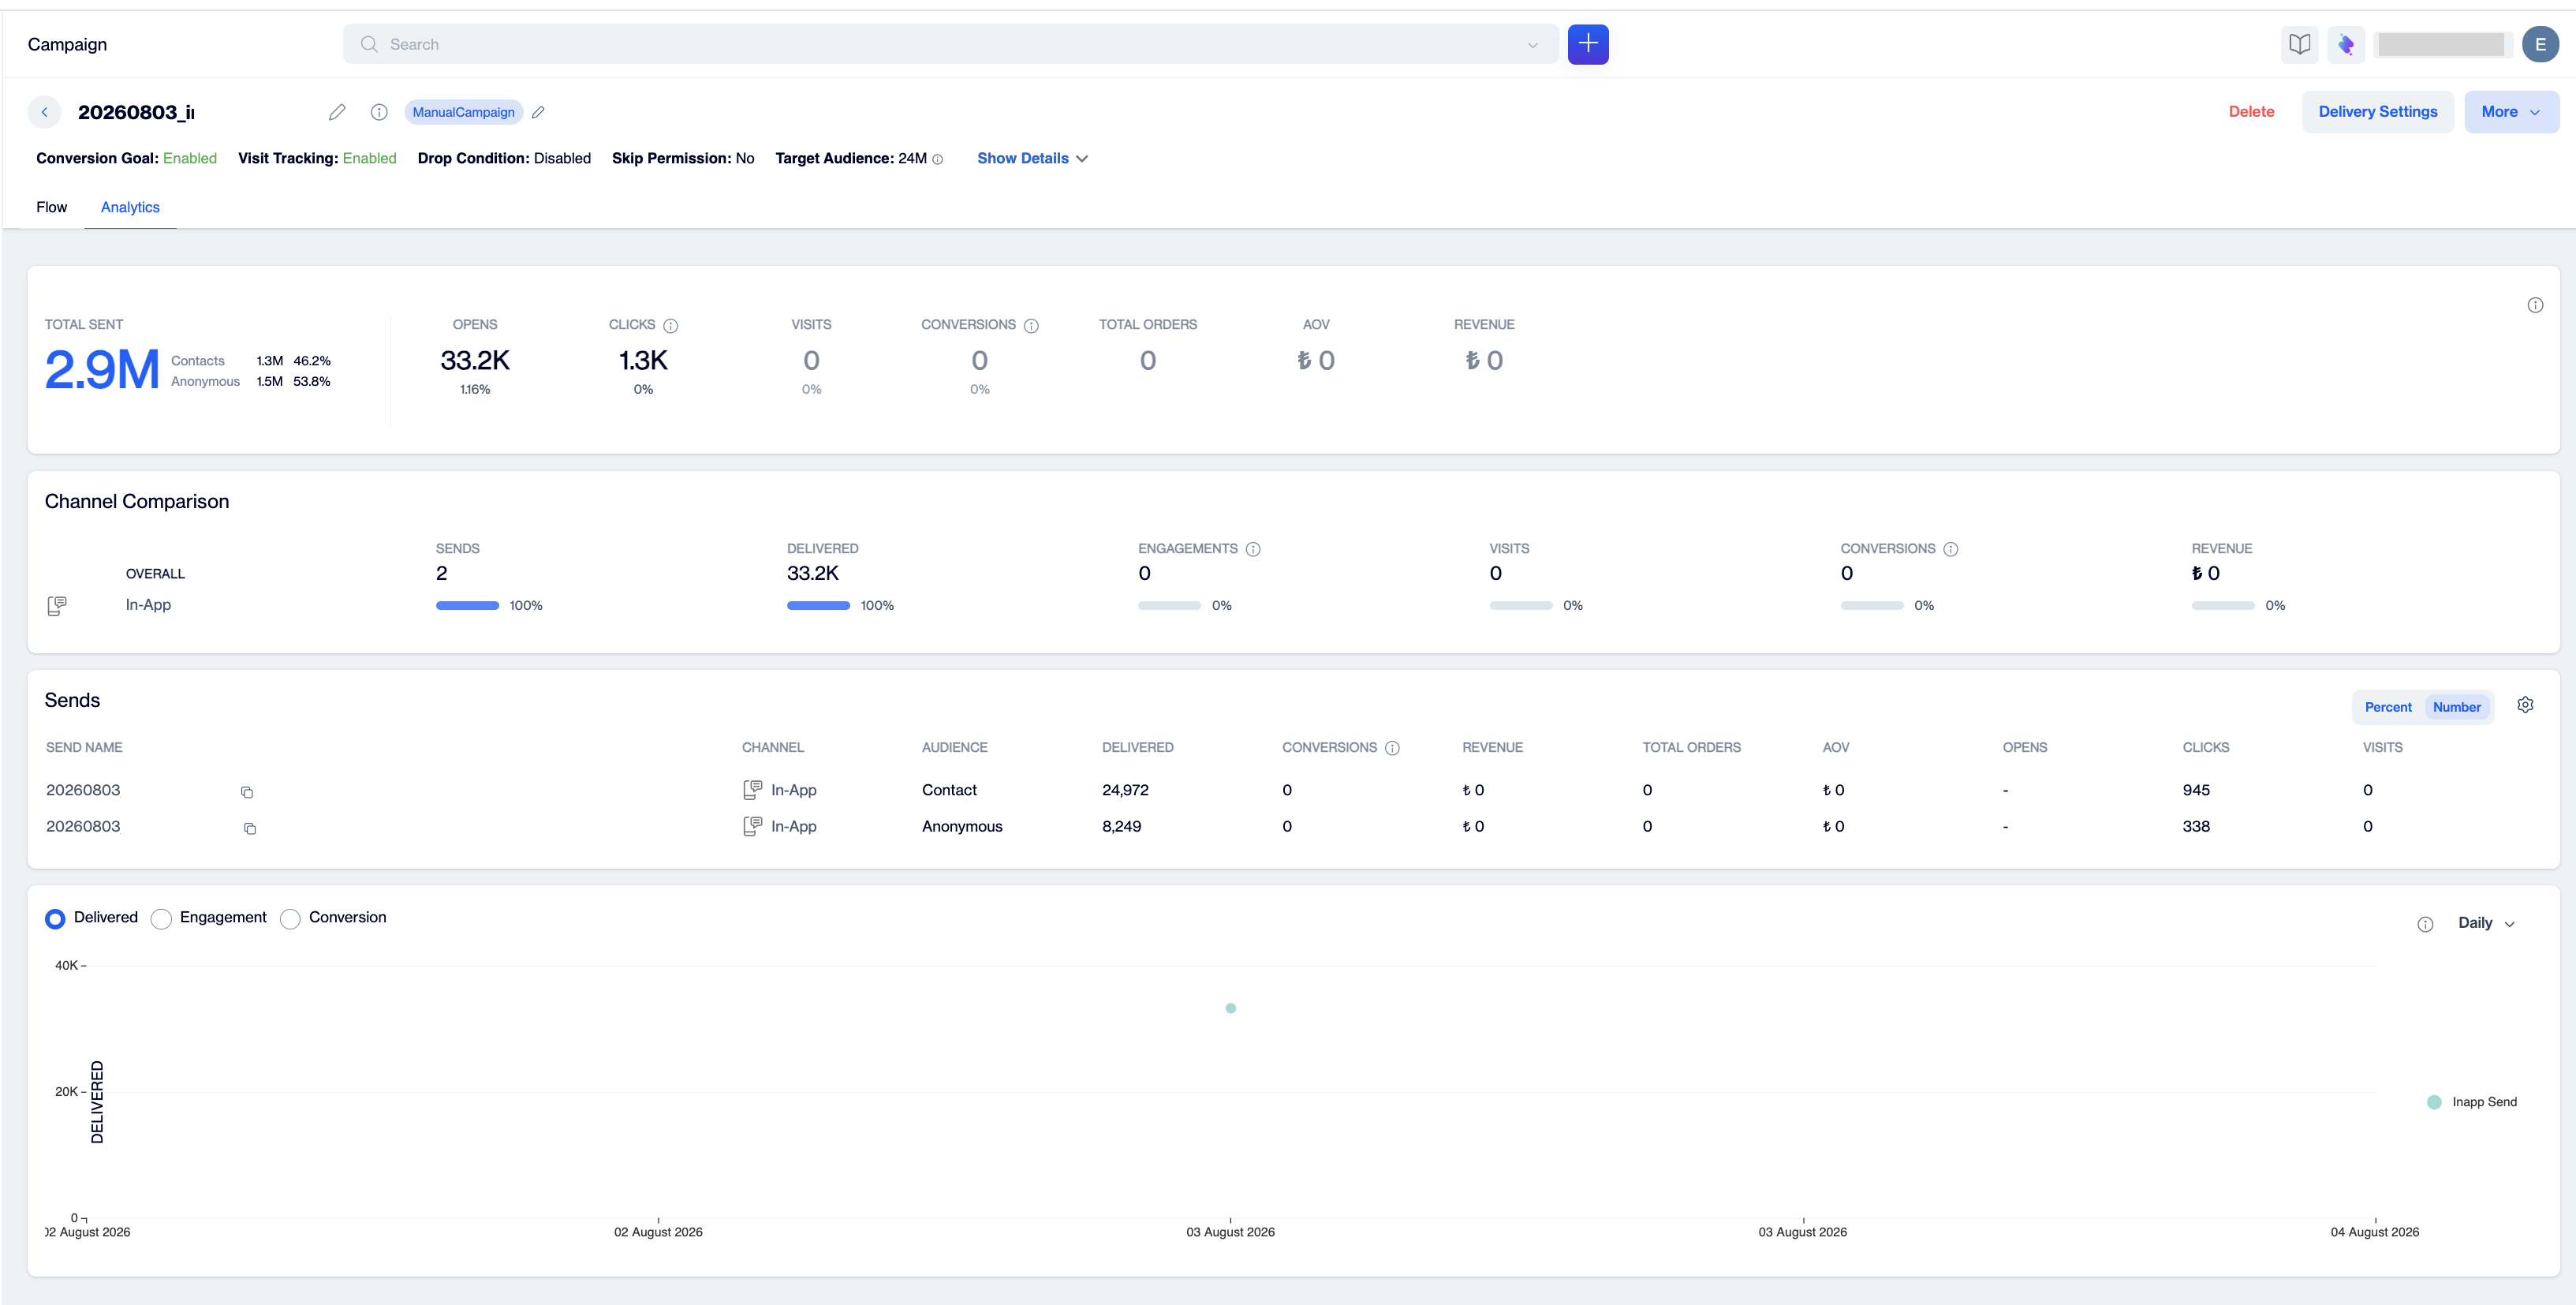
Campaign Analytics tab showing Total Sent split by Contacts and Anonymous with Opens and Clicks, Channel Comparison, the Sends table, and the performance chart.
The Analytics tab stops at delivery level numbers. To see what users did with an in-app message, open its detailed report.
2. In-App Detailed Report
How to Access
From the campaign flow:
- Open your campaign. It opens on the Flow tab.
- Click the In-App node. A summary popover opens with the template, start and end times, and the send's key counts: Sent, Displayed, Click, and Dismissed.
- Click View report. The report opens in a new tab.
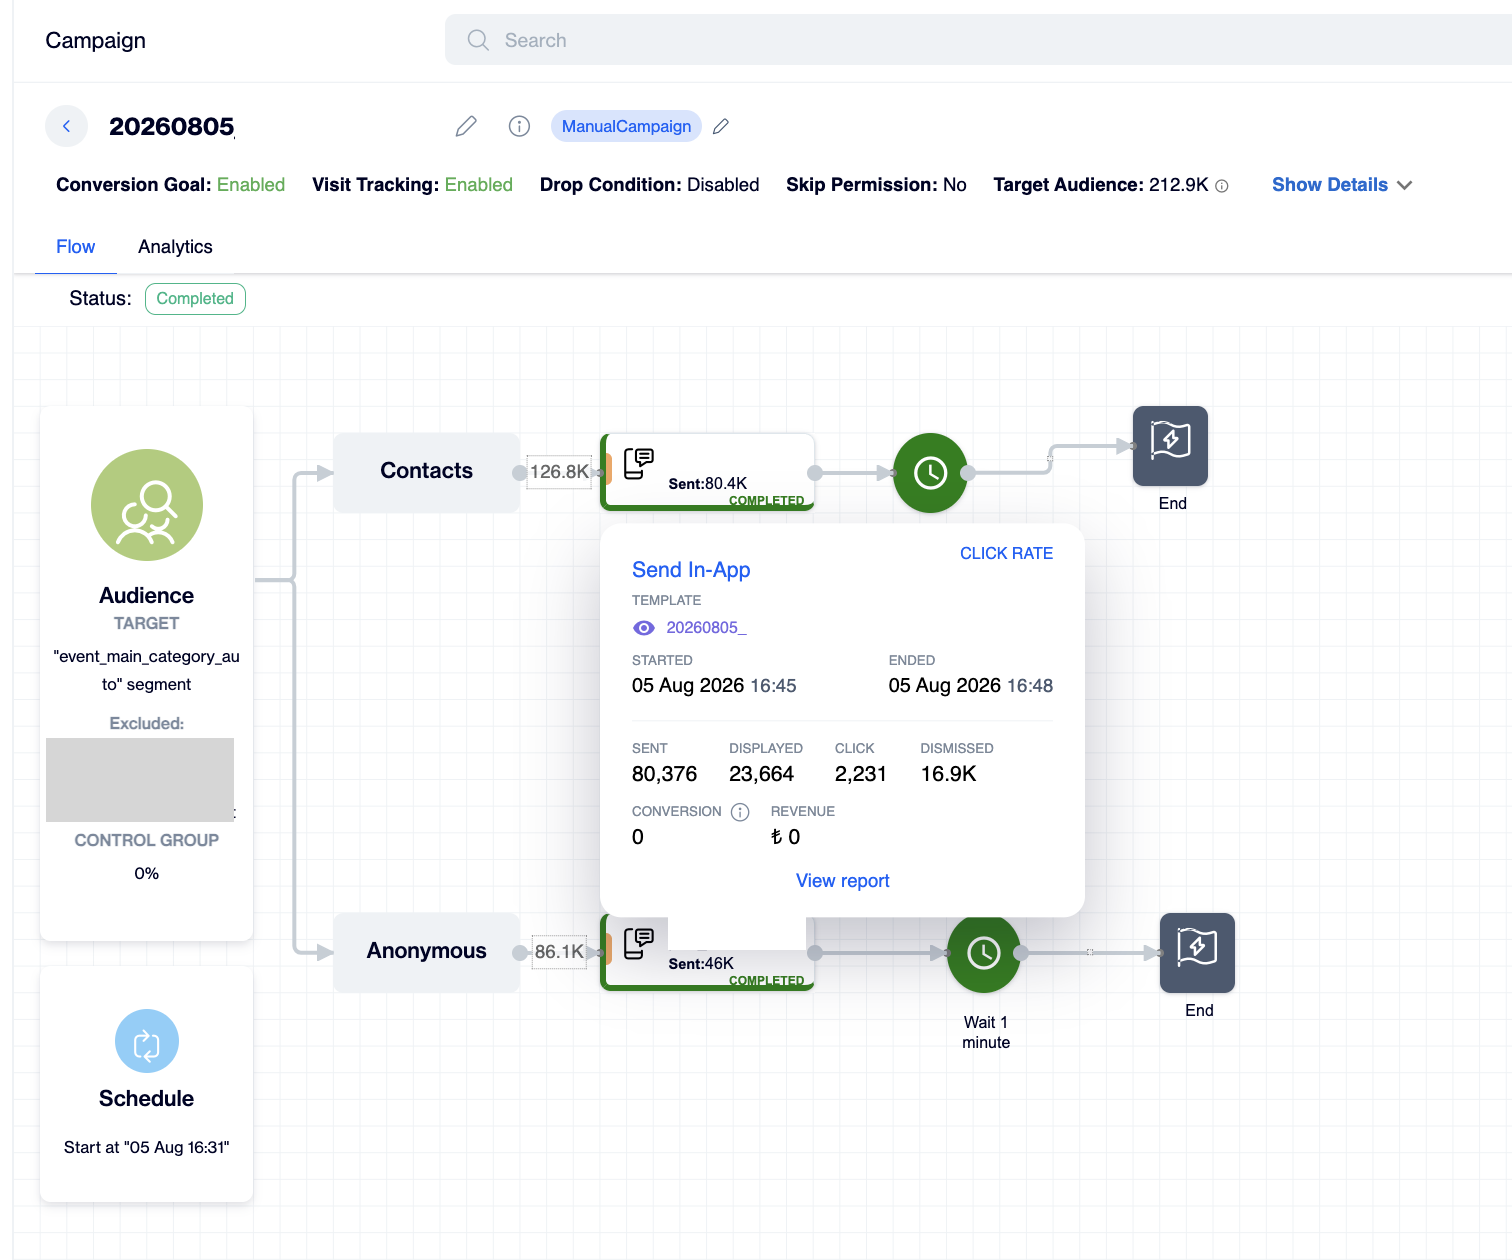
In-app node summary popover showing Sent, Displayed, Click, and Dismissed counts, with the View report link.
The report header displays the campaign name, the send status (for example, Completed), and Total Targeted, the number of users targeted by this send. The Public ID button provides shareable report access. Cancel Messages cancels this send's remaining queued messages; use it only if you want to stop the send.
A/B Split sends
When the send comes from an A/B Split node, the node summary on the Flow tab opens as the A/B Send summary. It shows each variant with its WINNER or LOSER badge and Opens count, the Started and Ended times of the test, the Click Rate, and the Sent, Displayed, Click, and Dismissed counters of the whole send. Click View report to open the detailed report.
In the detailed report, the Content Statistic panel next to the Content block on the Summary tab shows a thumbnail of each variant with its WINNER or LOSER badge and Open count. The other sections of the Summary tab and the Clients tab cover the whole send and are not split by variant. For the test configuration, see the A/B Split page.
Summary Tab
The Summary tab contains the overall performance of the send:
- Content card: A preview of the template, the Send Name, the Applications where the message appeared (the mobile or web apps with your Dengage SDK), and assigned Tags.
- Total Message: The number of in-app messages created for this send. Click more to see the Excluded, Has Error, and Unsent breakdowns.
- Displayed: Total and Unique display counts with the display percentage. A display means the message was shown to a user inside the app; it is the in-app equivalent of an email open.
- Clicks: Total and Unique click counts with the click percentage.
- Dismissed: Total and Unique dismiss counts with the dismissal percentage. A dismiss means the user closed the message without clicking. It is not a delivery failure.
- Clicks By Device: A donut chart that splits clicks across Mobile Phone, Desktop, Tablet, and Unknown devices. The legend also shows the dismiss count for each device type.
- In-App Send Performance: A funnel from Total Message to Display to Click, with the Display Rate and Click Rate. Messages that never display point to delivery settings or SDK integration; displays without clicks point to content.
- Button Clicks: Click counts for each button in the message, so you can see which call to action drove the engagement. This section is specific to the in-app report.
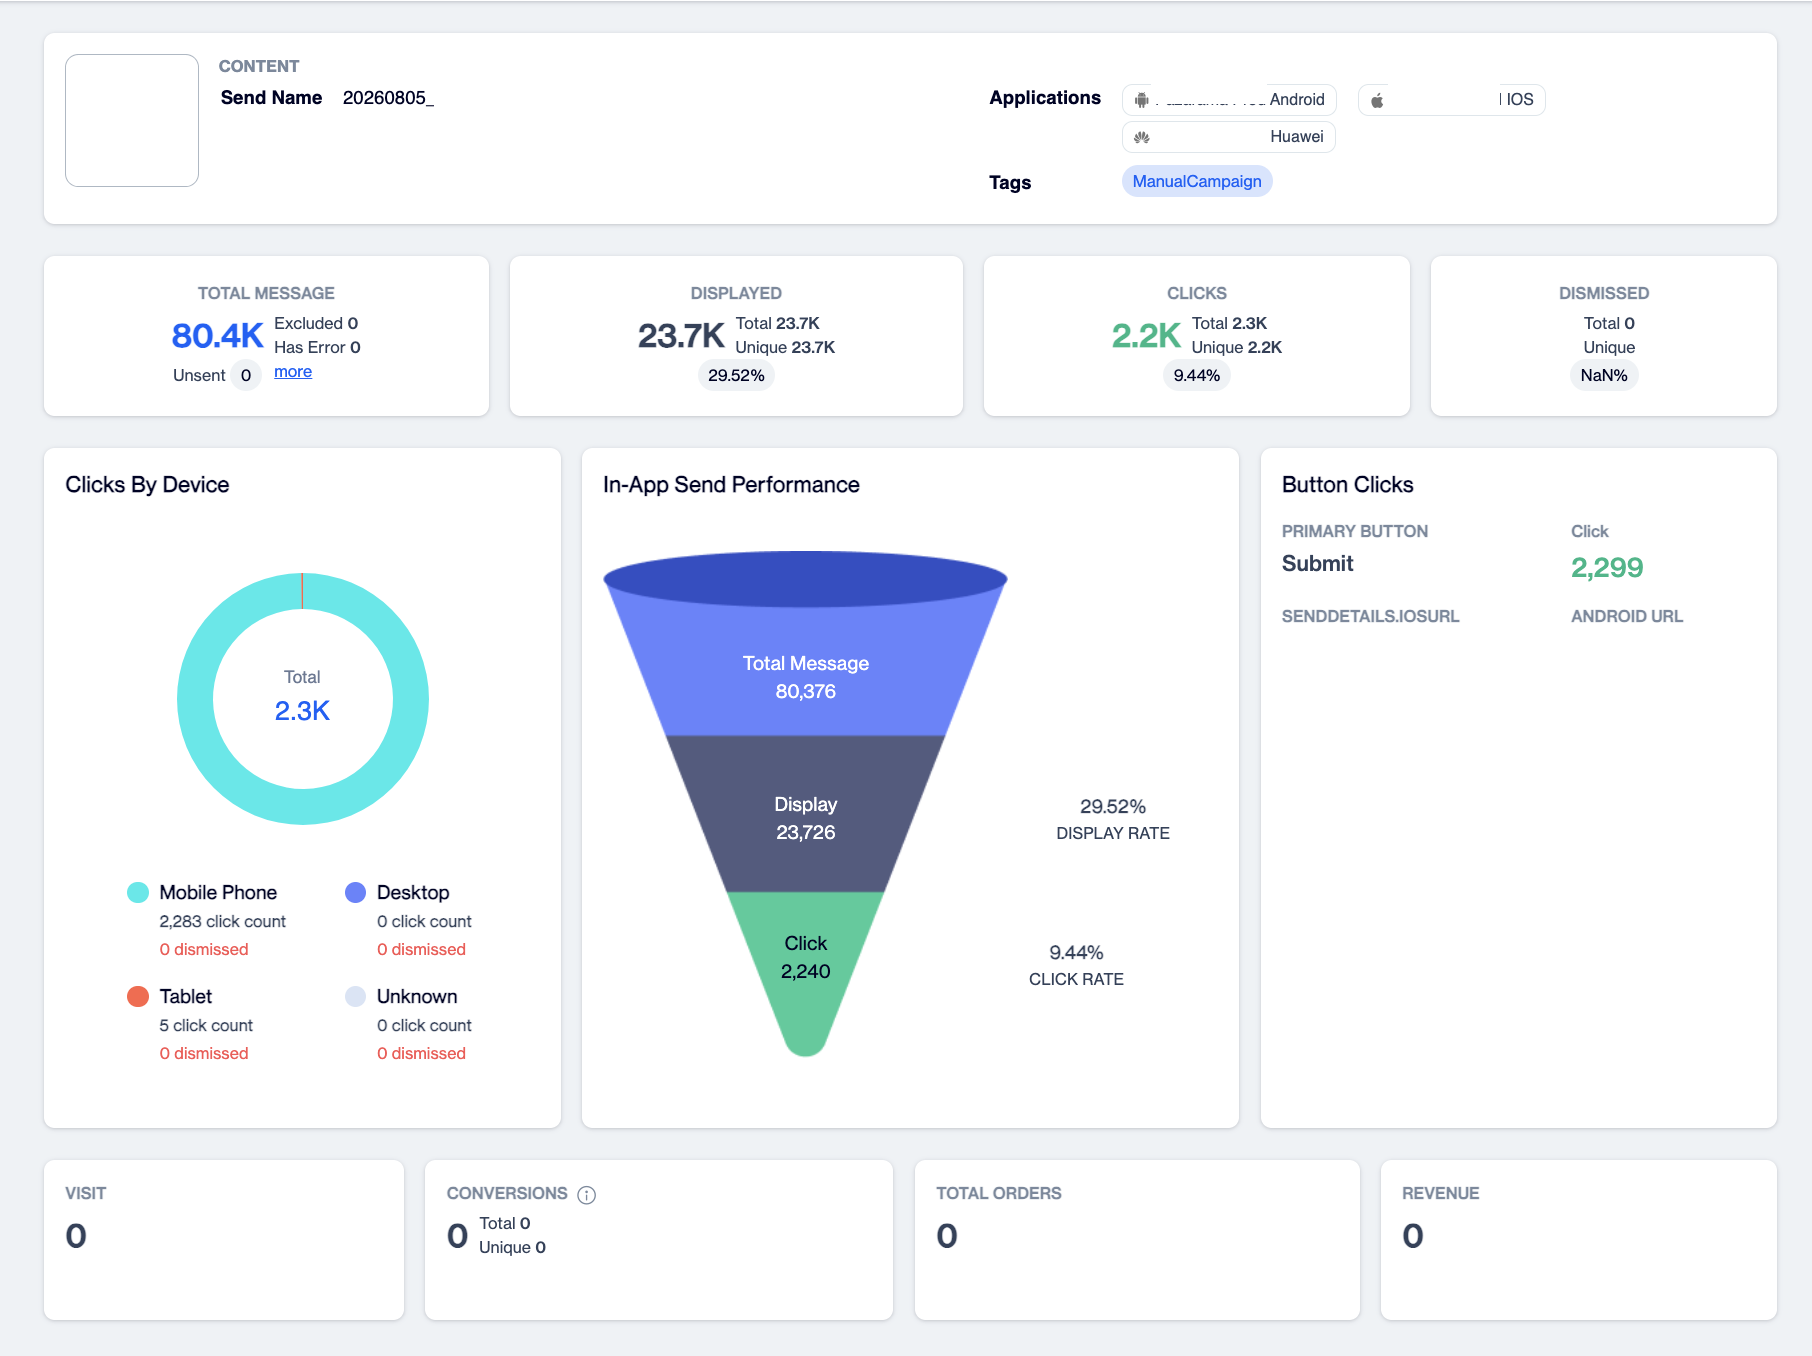
Summary tab with the four metric cards, Clicks By Device chart, In-App Send Performance funnel, and Button Clicks card.
Clients Tab
The Clients tab shows where interactions came from:
- Applications: The Displayed Count, Click Count, and Dismissed count for each application, with a comparison chart.
- Device Types, Operating System, and Device Brands: Breakdowns generated from display, click, and dismiss signals. These sections show "No information found" until the send has recorded activity.
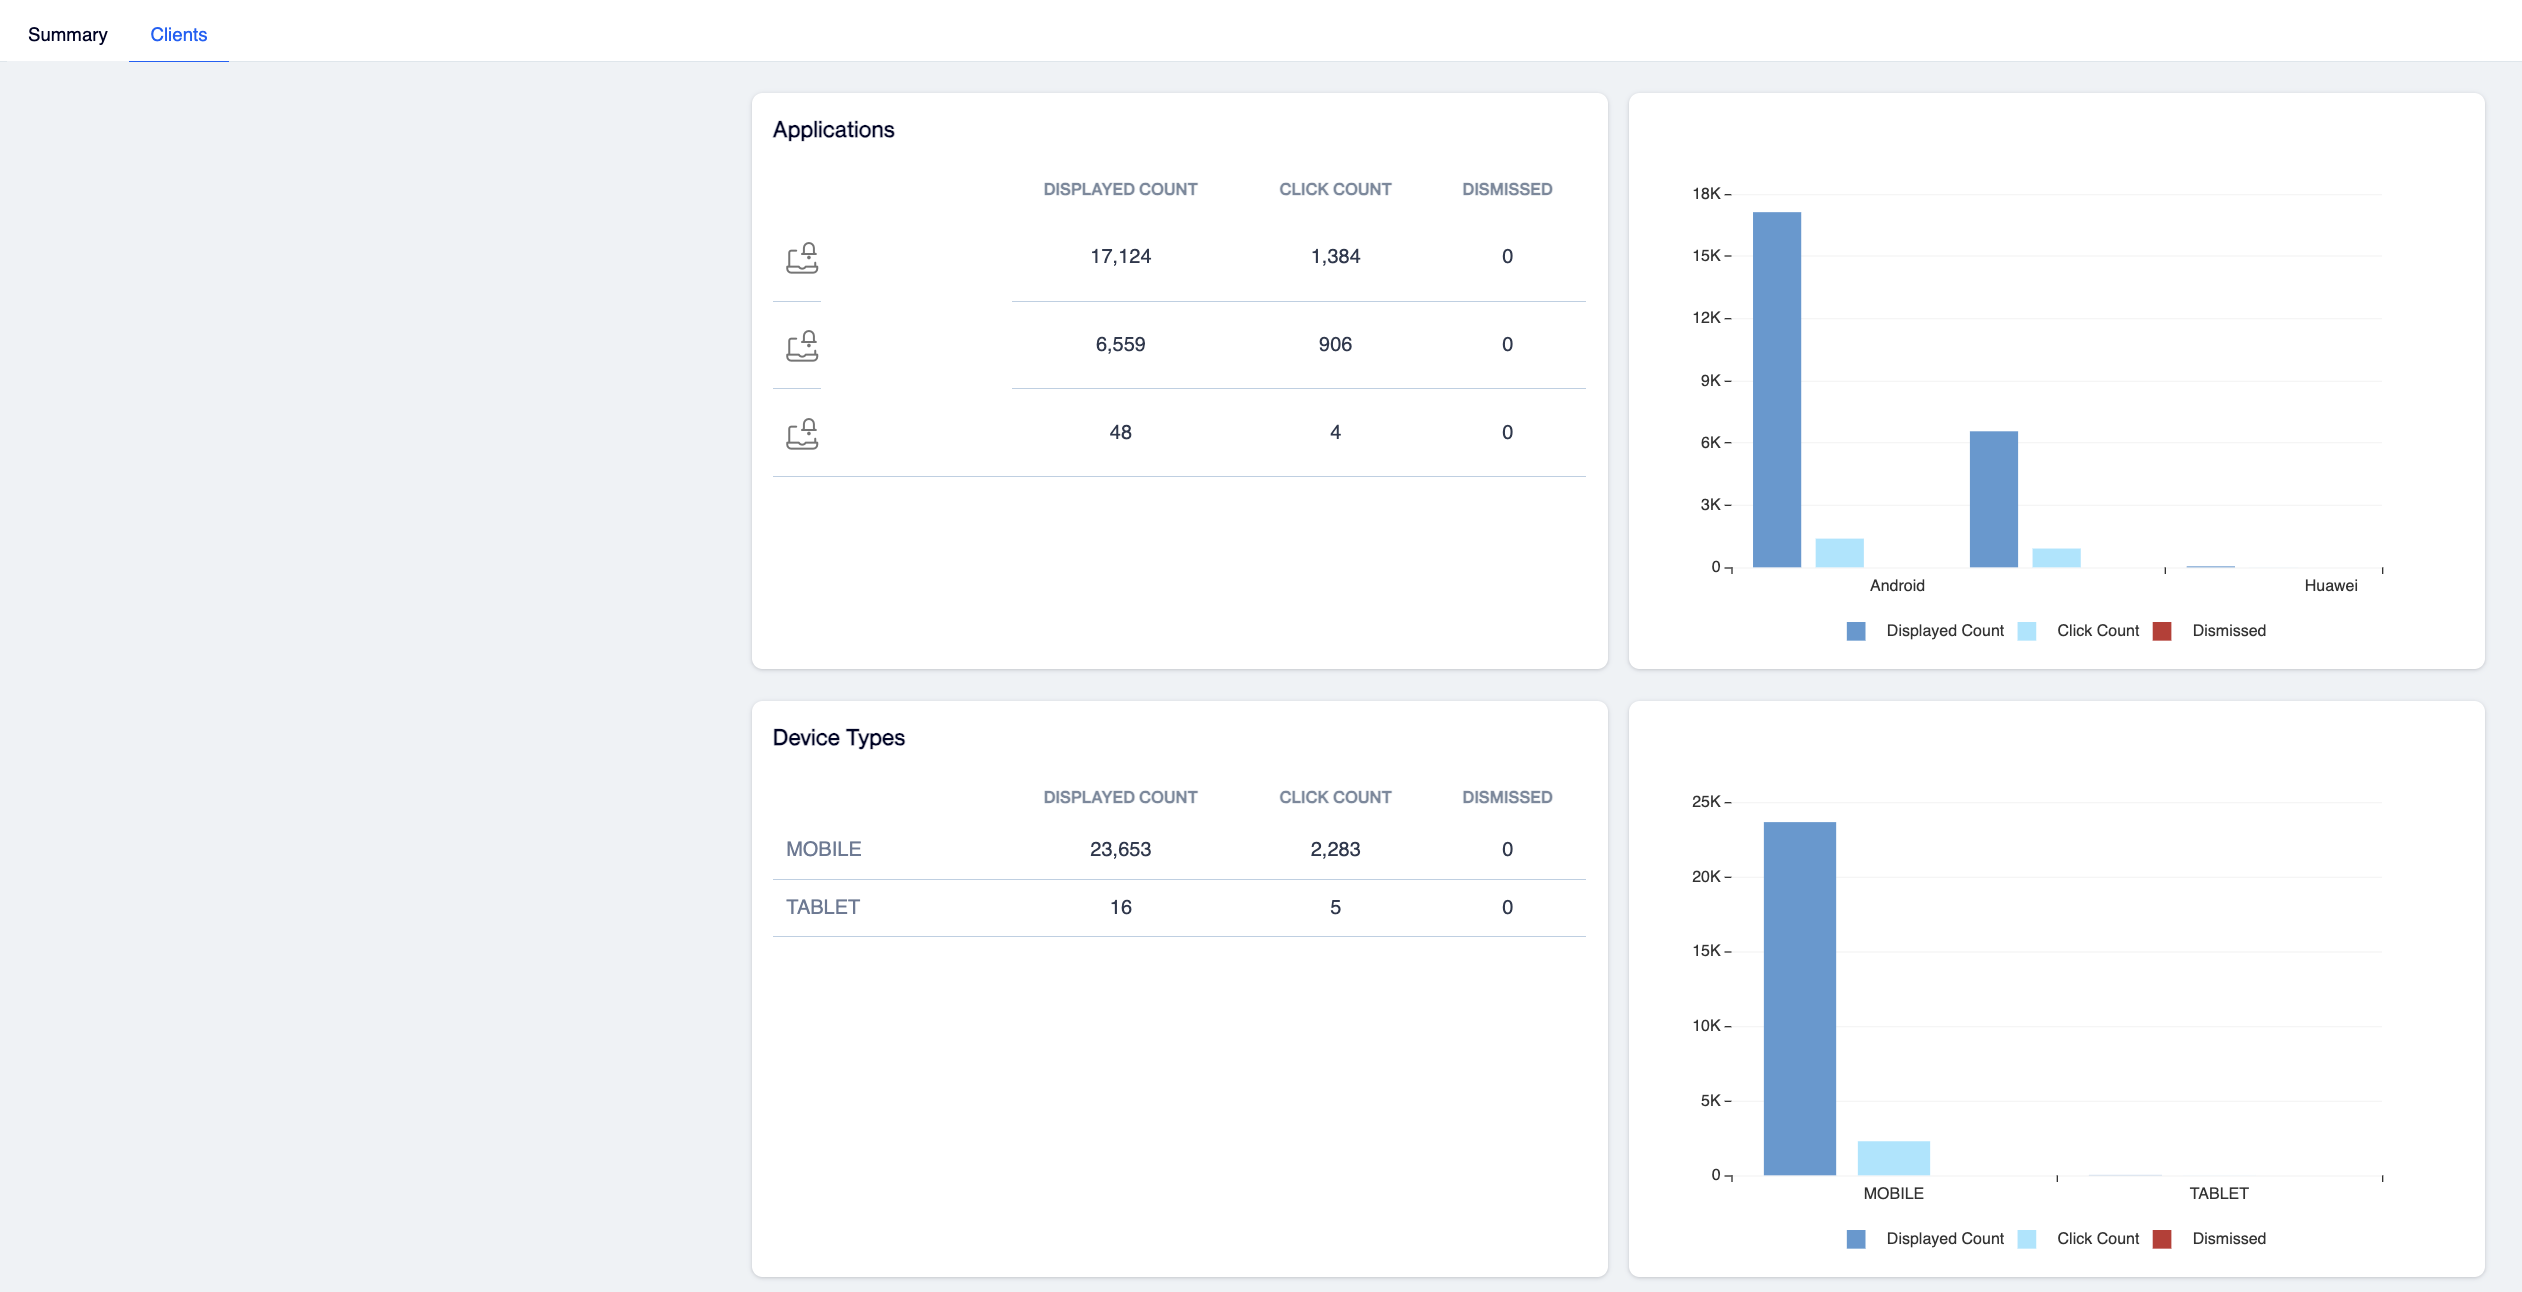
Clients tab showing Displayed, Click, and Dismissed counts per application, with Device Types, Operating System, and Device Brands sections.
Metrics Reference Table
| Metric | Definition |
|---|---|
| Total Sent | All messages sent by the campaign, shown on the Analytics tab with the Contacts and Anonymous breakdown. |
| Contacts / Anonymous | Registered users vs unregistered or unidentified users. |
| Opens (campaign level) | For in-app sends, displays reported at the campaign level: an in-app display counts as an open. The per-send Opens column in the Sends table shows "-". |
| Engagements | Total click interactions with the channel's messages, shown in Channel Comparison. |
| Total Targeted | The number of users targeted by the send, shown in the detailed report header. |
| Total Message | In-app messages created for the send. Breakdowns: Excluded (filtered out by rules or audience filters), Has Error (failed with an error), Unsent (not sent). |
| Displayed / Unique Display | Total and unique times the message was shown to users in the app. The in-app equivalent of an email open. |
| Display Rate | Displays / Total Message: the share of created messages that were shown. |
| Click / Unique Click | Total and unique clicks on the message. |
| Click Rate | Clicks / Displays: the share of displays that led to a click. |
| Dismissed / Unique Dismiss | Total and unique times users closed the message without clicking. Not a delivery failure. |
| Button Clicks | Click counts per button in the message, shown in the Button Clicks card of the Summary tab. |
Prerequisites
- The report becomes available after the send runs; engagement metrics populate as display, click, and dismiss signals arrive from the SDK.
- Recurring campaigns require a Job Version and Date Range selection before generating the report.
- The Clients tab and the device breakdowns need display, click, or dismiss signals; they show "No information found" until then.
Updated about 20 hours ago