
RFM Analysis
The Analysis module aims to help businesses understand customer behavior, identify high-value segments, and optimize engagement strategies. By leveraging RFM (Recency, Frequency, and Monetary) scoring, the module enables data-driven decision-making, targeted retention efforts, and personalized campaigns to enhance customer loyalty, reduce churn, and maximize revenue.
How RFM Scoring Works
RFM analysis ranks every contact on three dimensions of purchase behavior:
| Dimension | What it measures |
|---|---|
| Recency (R) | How many days have passed since the contact's last purchase. Lower is better. |
| Frequency (F) | How many purchases the contact has made in the analysis period. Higher is better. |
| Monetary (M) | The total amount the contact has spent. Higher is better. |
Each contact receives a combined RFM Score, and based on that score is placed into one of nine segments. Segments are recalculated automatically, so contacts move between segments as their behavior changes — you can track these movements in the Transition tab.
The Nine RFM Segments
| Segment | Who they are | Recommended Action |
|---|---|---|
| Champions | Bought recently, buy often, and spend the most. Your best customers. | VIP treatment, early access to new products, exclusive offers. Invite them to refer friends or leave reviews. |
| Loyal | Purchase regularly and respond well to your campaigns, though not always top spenders. | Nurture with loyalty programs and personalized upsell/cross-sell recommendations. Keep engagement steady -don't over-discount. |
| New Customers | Made their first purchase very recently. | Run a welcome flow: onboarding content, product education, and a time-limited incentive for the second purchase |
| Promissing | Bought recently but with low frequency and spend so far. | Build the habit: product recommendations, social proof, and small incentives to drive the next order. |
| Need Attention | Around-average recency, frequency, and monetary values - engagement is starting to slip. | Re-engage now with limited-time offers and recommendations based on their past purchases, before they drift further. |
| About to Sleep | Below-average recency and frequency; close to churning. | Reactivate with your most popular products or a compelling discount. Test a different channel (push/SMS) if email goes unopened. |
| At Risk | Used to buy often and spend well, but haven't purchased in a long time. | Win them back with personalized reactivation campaigns referencing what they used to buy. Escalate offer strength over time. |
| Cannot Lose Them | Your historically most valuable customers who have gone quiet. | Highest-priority win-back: strong personal outreach, exclusive renewal offers. Losing this group is losing your former Champions. |
| Lost Customers | Lowest recency, frequency, and monetary scores; effectively churned. | Try one strong "we miss you" offer. If there's no response, suppress them from paid and high-frequency channels to protect deliverability and budget. |
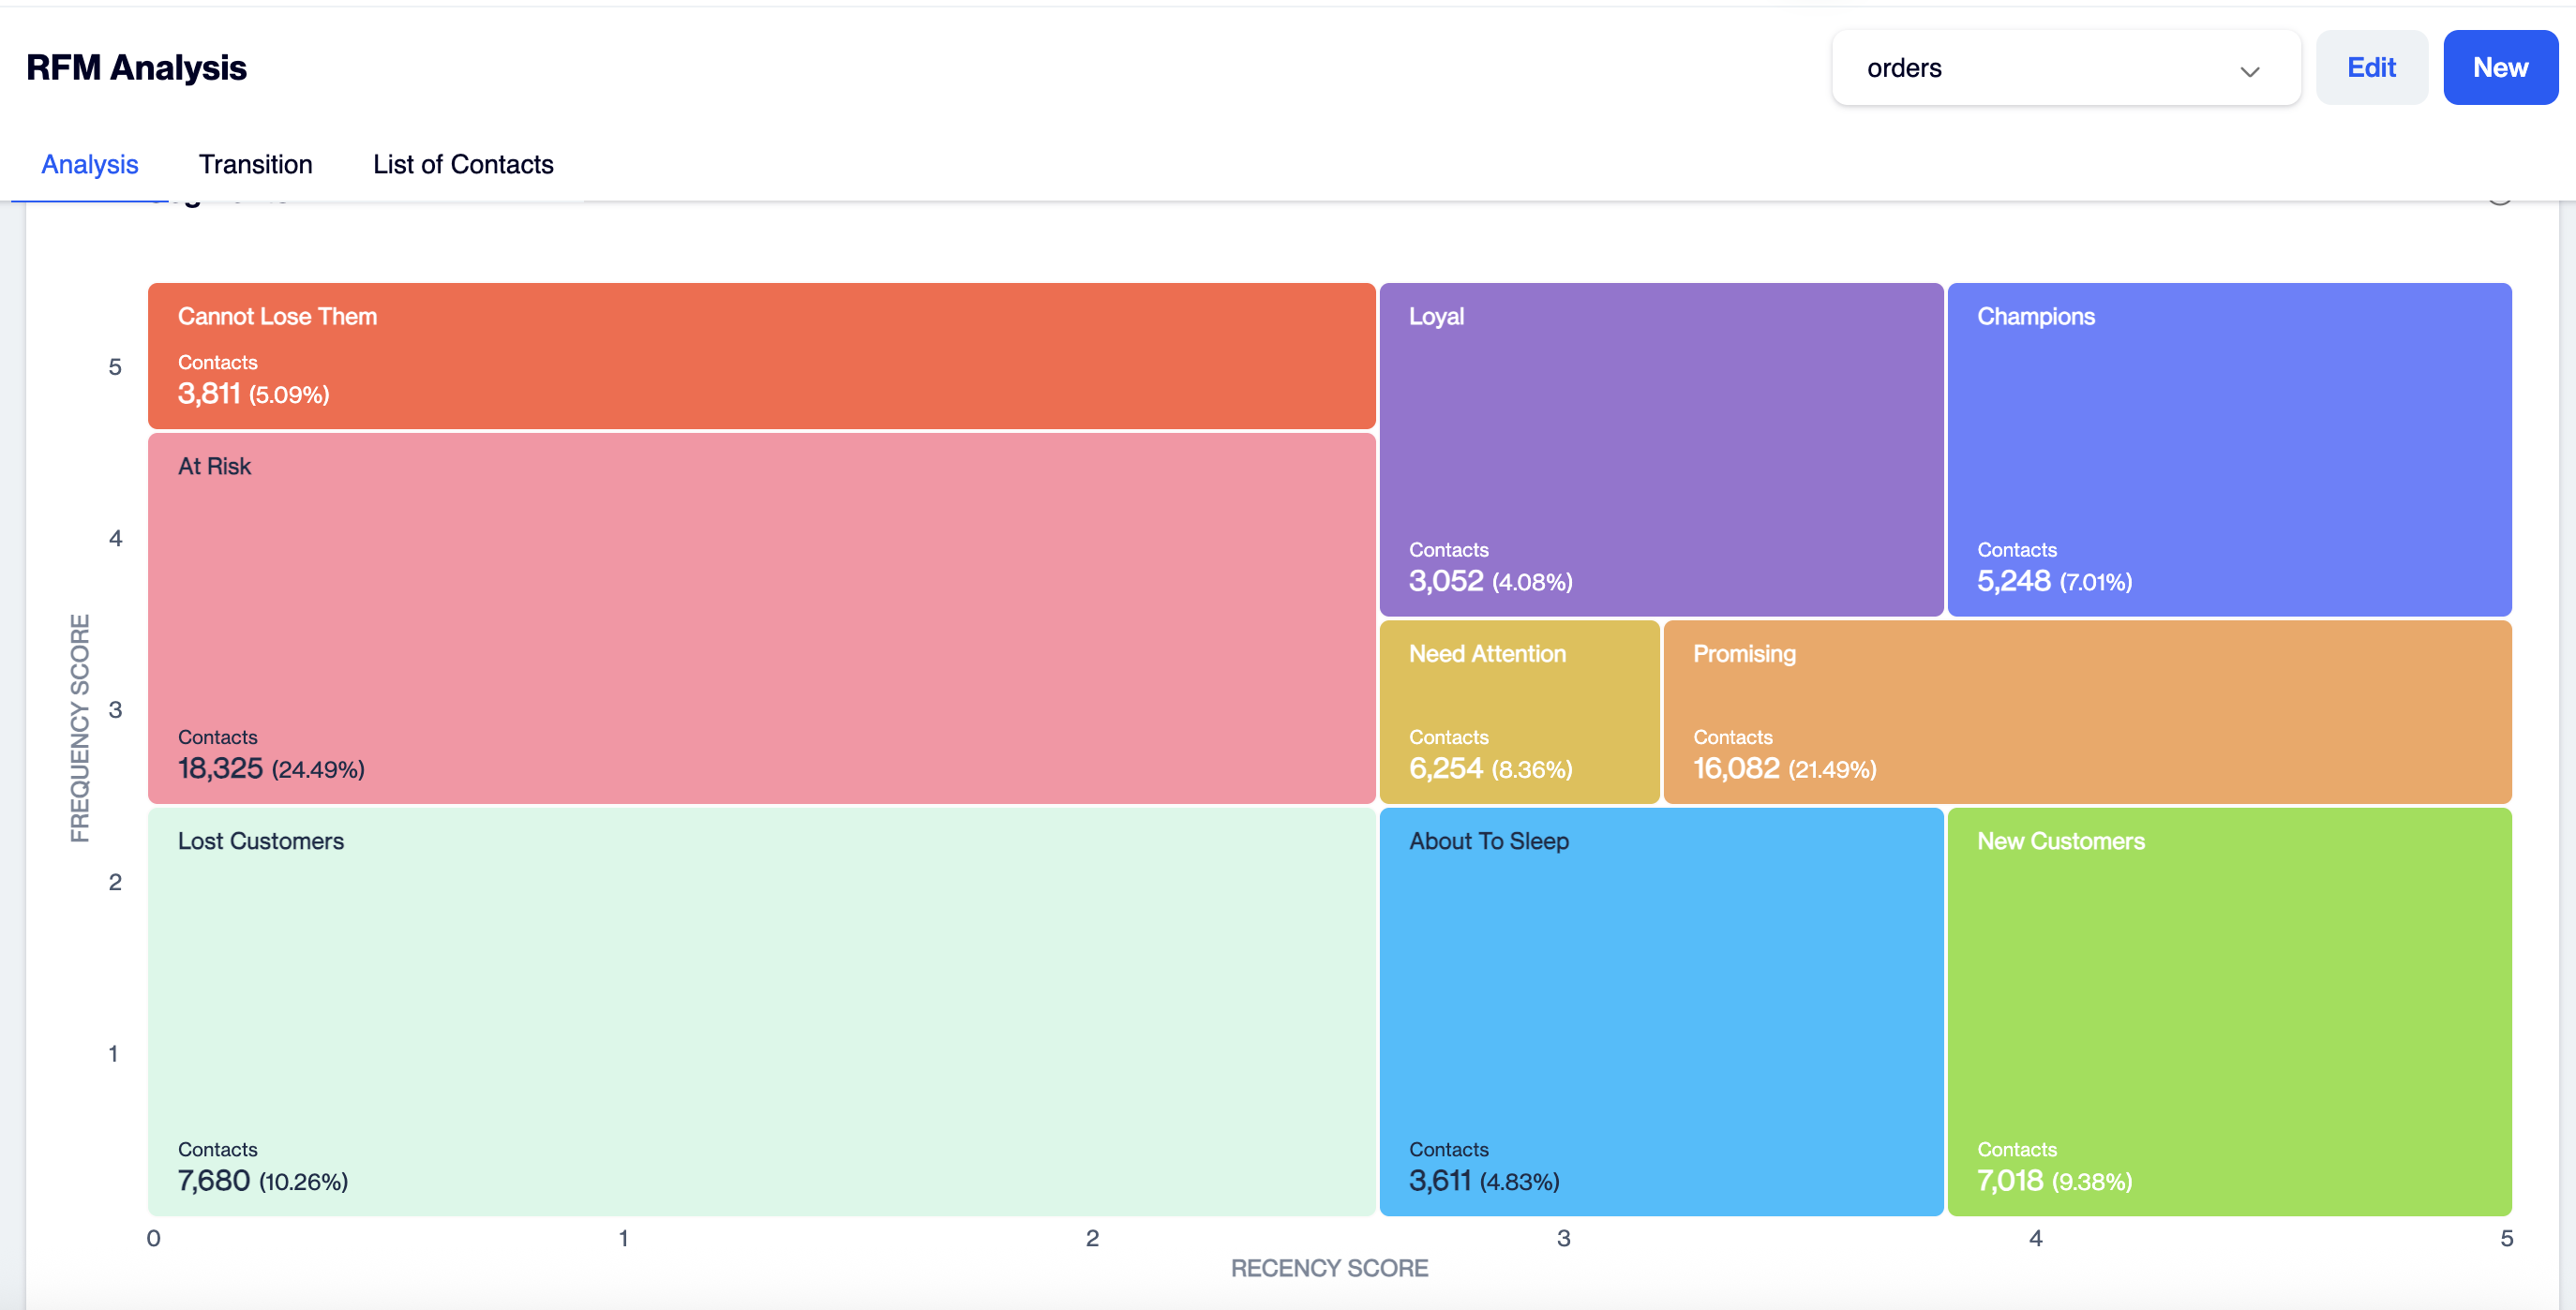
RFM Analysis
Each segment is visually represented with distinct color schemes, making it easy to interpret. The module also provides insights into revenue distribution by RFM score, highlighting the contribution of each segment to the overall revenue. This helps businesses identify high-value customers, develop targeted retention strategies, and implement personalized campaigns to improve engagement, reduce churn, and maximize revenue.
The Revenue by RFM Score section provides a detailed breakdown of customer segments and their financial contributions. It includes the following metrics: segments, total number of contacts in each segment, percentage of contacts, total revenue generated by each segment, percentage of total revenue, Average Order Value (AOV), and Average Customer Lifetime Value (AVG. CLV). This comprehensive view enables businesses to evaluate the performance of each segment, identify high-value customers, and make data-driven decisions to optimize revenue and customer engagement strategies.
The number of users under the segment on this screen is calculated based on the RFM scores of the users in the last 12 months. If the user has moved from segment A to segment B during this period, the user's record is in segment B (final status). In the analysis on this screen, a user is evaluated under only one segment. If the user has not made any segment changes in the last 12 months, it is not included in the calculations on this screen.
Transition
The transition section analyzes incoming transitions displayed in a segment-wise pie chart. Users can click on any segment to view detailed insights for that specific category. Additionally, date filters can be applied to refine the segment analysis.
The number of users under the segment on this screen is calculated based on all users currently in that segment. There is no 12-month restriction as in the Analysis screen. In addition, the number of transitions between segments in the selected time period is also shown on this screen.
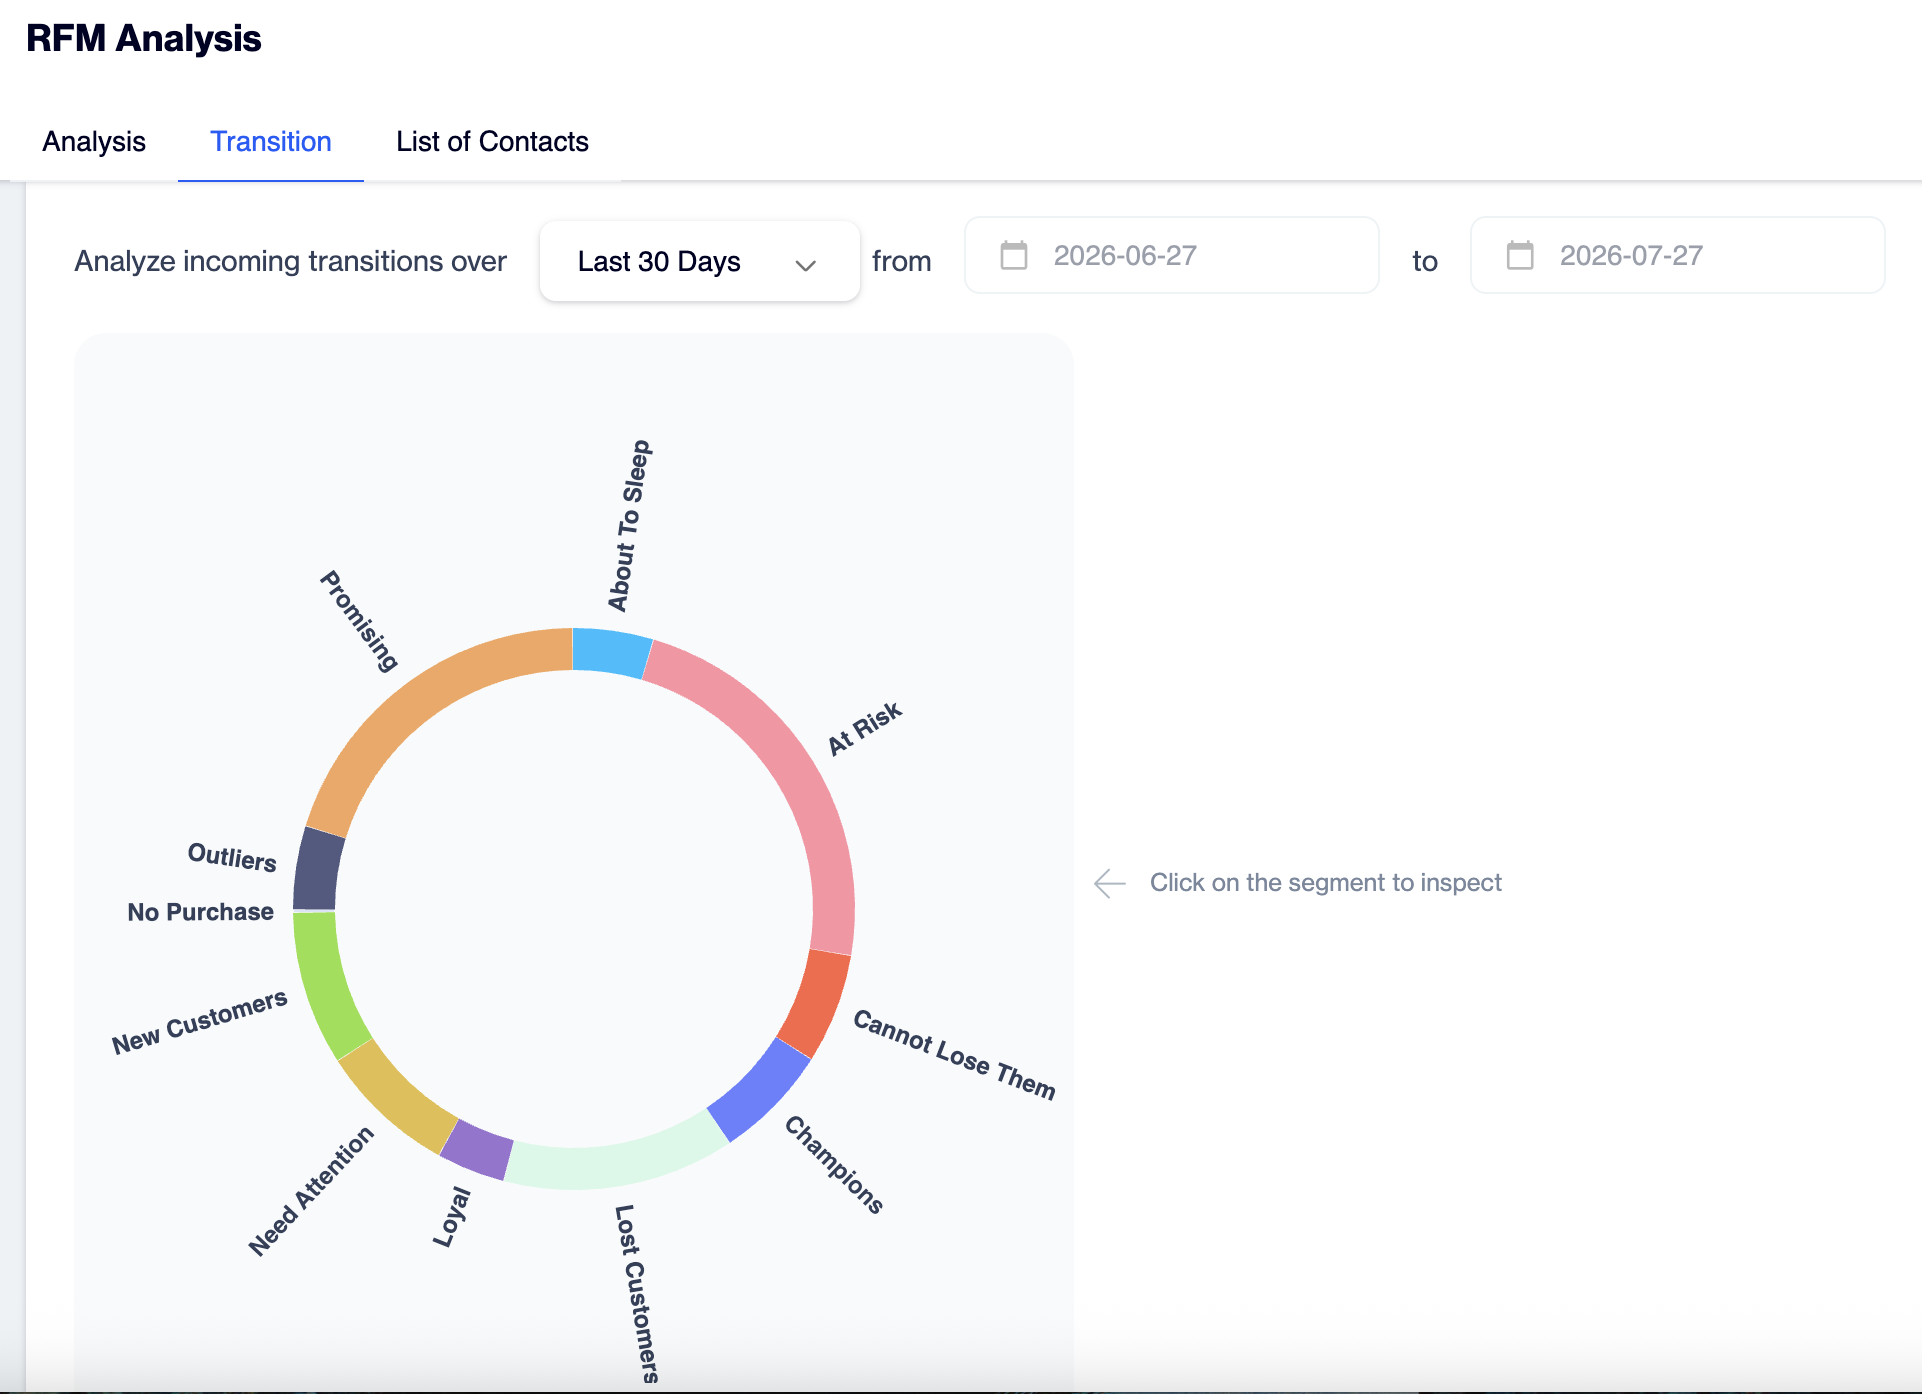
Transition
List of Contacts
This screen provides an overview of customer data segmented using RFM (Recency, Frequency, Monetary) analysis, enabling businesses to understand and categorize their customers effectively. The table includes the following columns:
- Contact Key: A unique identifier for each customer.
- Customer: The name or email address of the customer.
- RFM Segment: A category assigned to customers based on their RFM scoring, such as "Promising," "At Risk," or "Champions."
- RFM Score: A combined score reflecting the customer's recency, frequency, and monetary activity.
- Recency (Days): The number of days since the customer's last activity.
- Frequency (Count): The total number of interactions or purchases made by the customer.
- Monetary Value: The total monetary contribution of the customer.
- CLV (Customer Lifetime Value): A customer's lifetime value classification, such as "low."
The screen includes interactive features such as a search bar to quickly find specific customers, filters to refine the data based on name, activity, or monetary value, and a download option for exporting the data. Users can also navigate the dataset using the pagination controls at the bottom. This screen provides a comprehensive and actionable view of customer data, allowing businesses to make informed decisions.
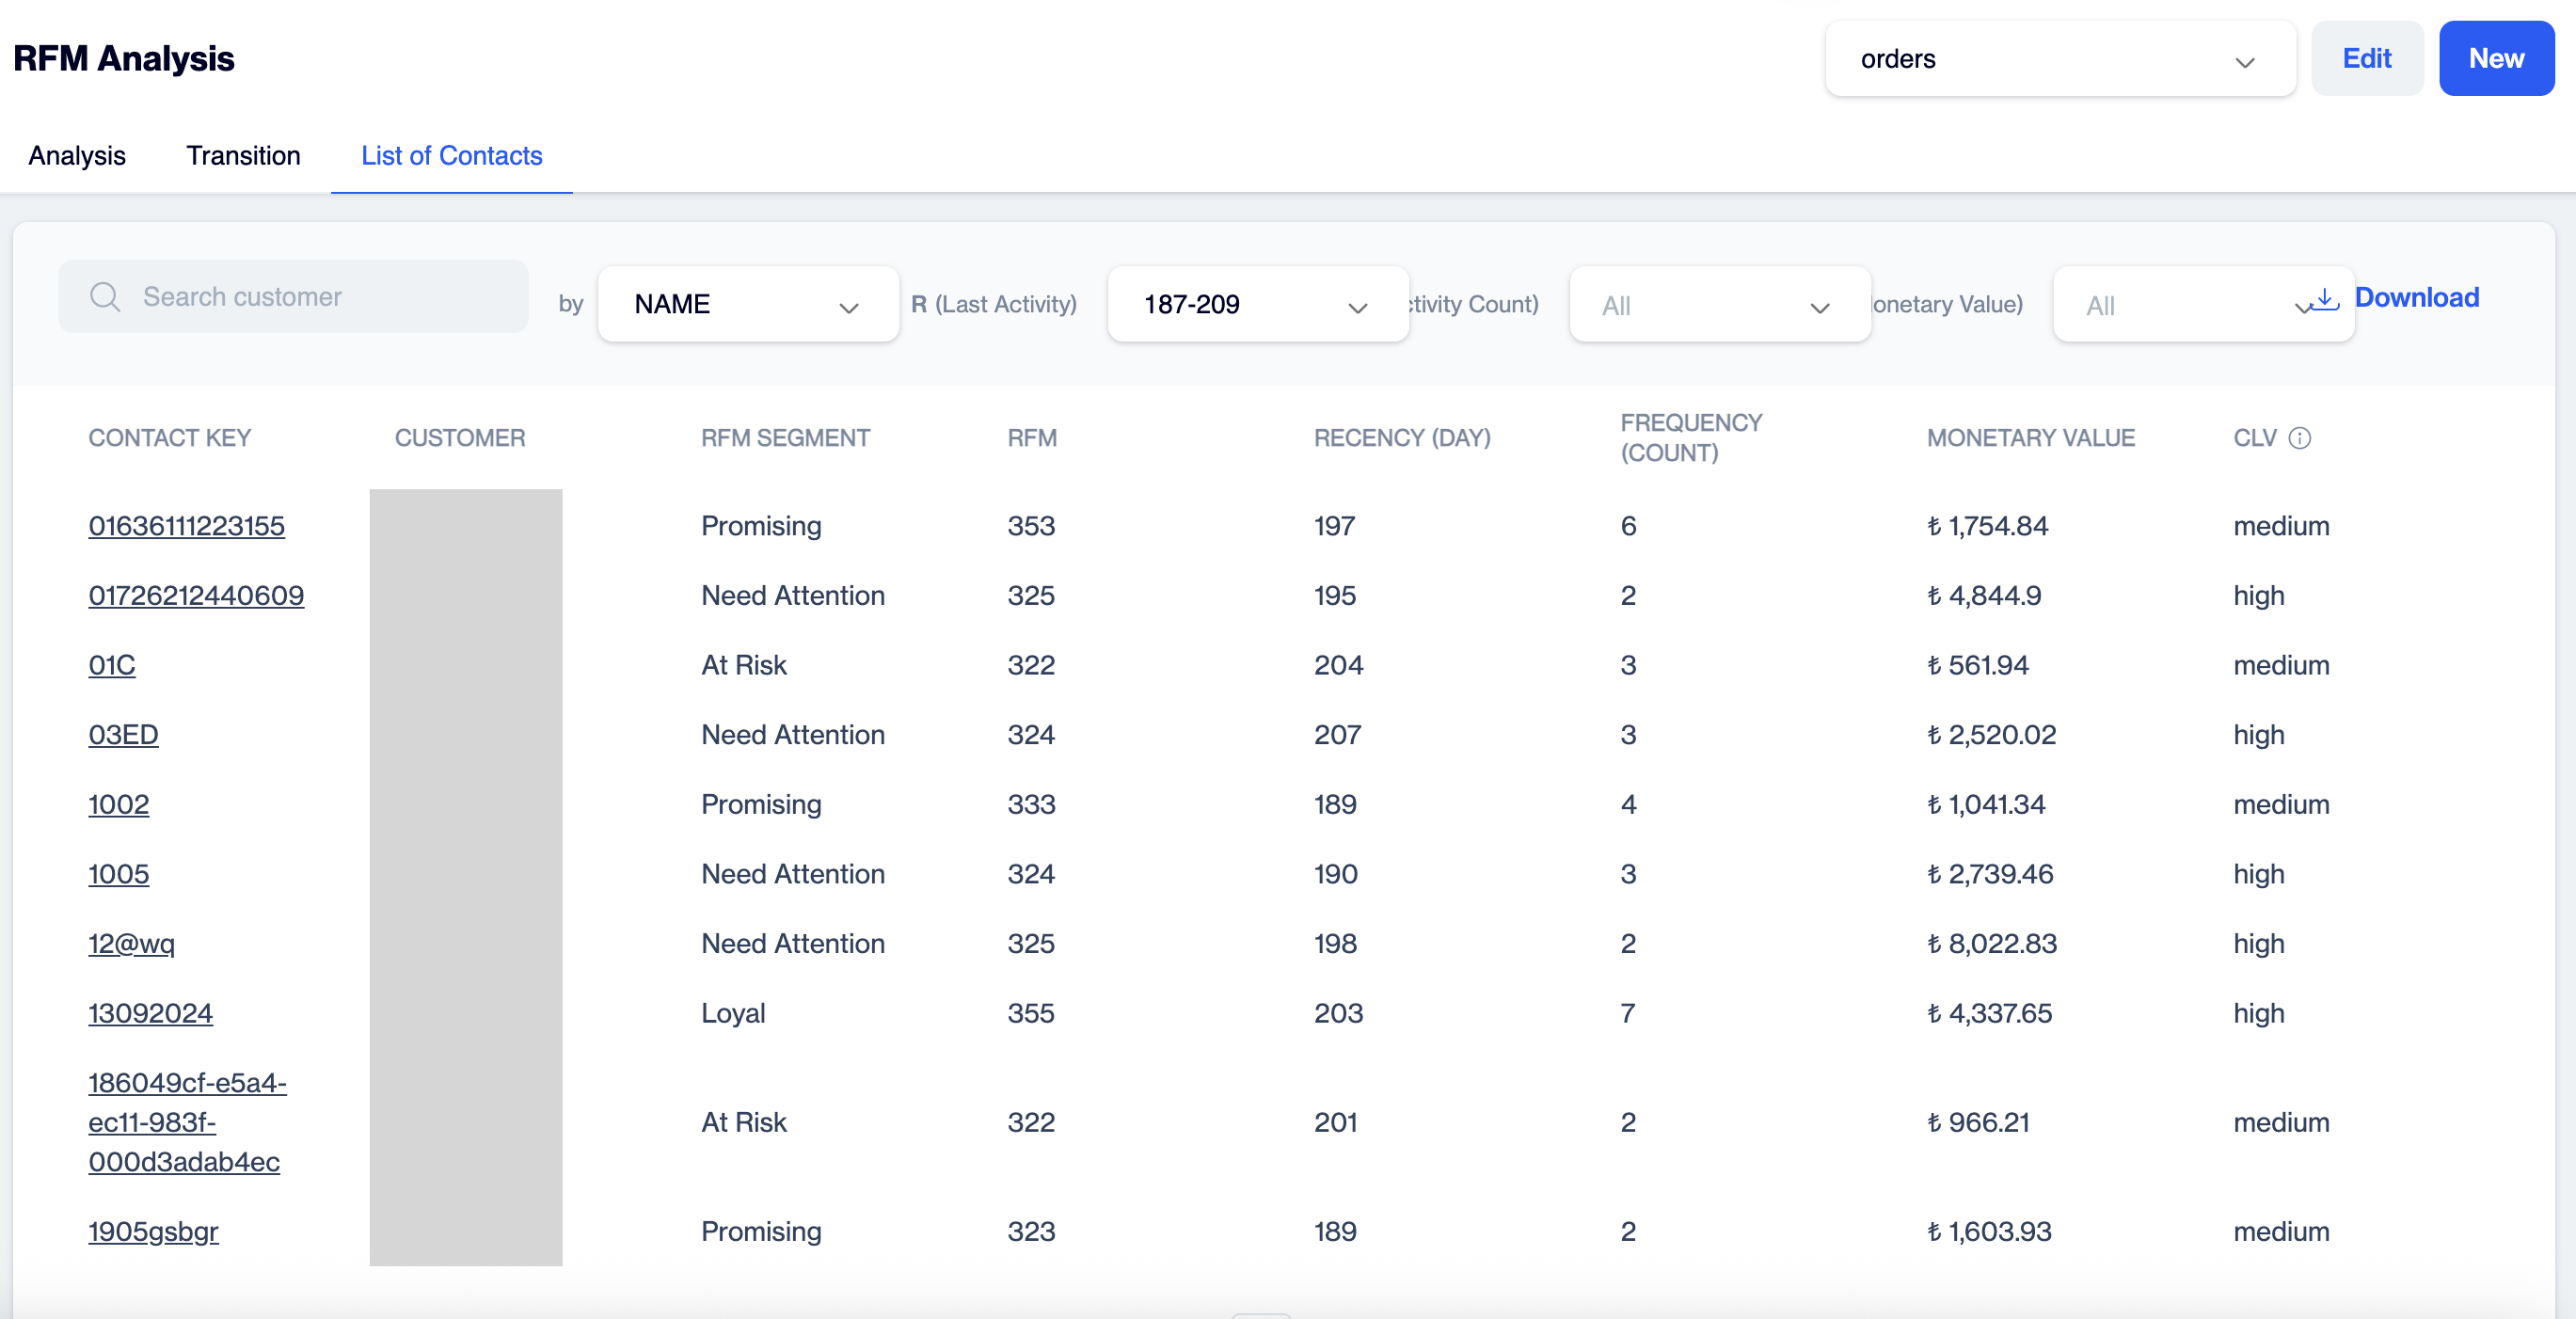
List of Contact
Updated 3 months ago