
Email Analytics
Email campaigns give you two reports. The campaign's Analytics tab shows totals for the whole flow, covering every send and every channel it uses. The Email Detailed Report drills into one email send and shows how recipients behaved: delivery, opens, clicks, domain performance, link level clicks, a click heat map, and the browsers and devices used.
| You want to... | Use |
|---|---|
| See campaign totals, compare channels in the flow, or follow the trend over time | Campaign Analytics tab |
| See how one email send performed: delivery, opens, clicks, domains, link clicks, heat map, browsers and devices | Email Detailed Report |
1. Campaign Analytics Tab
How to Access
- Go to Campaign > Flows and select the One Time or Recurring tab.
- Click the three dots at the end of the campaign row and select Flow/Analytics. Alternatively, click the campaign name and then click the Analytics tab.
For recurring campaigns, select the Job Version and set the Date Range, then press the Report button to generate the report.
What It Shows
- Total Sent: All messages sent by the campaign, split into Contacts (registered users) and Anonymous (unregistered or unidentified users), with Opens and Clicks beside it. Hover a card to see its Contacts and Anonymous split.
- Channel Comparison: Sends, Delivered, and Engagements for each channel, so you can compare email against the other channels the campaign uses.
- Sends table: One row per send with Send Name, Channel, Audience (Contact or Anonymous), Delivered, Opens, and Clicks. Use the Percent / Number toggle to switch how values display, and the gear icon to configure columns.
- Performance chart: A time chart of Delivered or Engagement, switchable between daily, weekly, and monthly views.
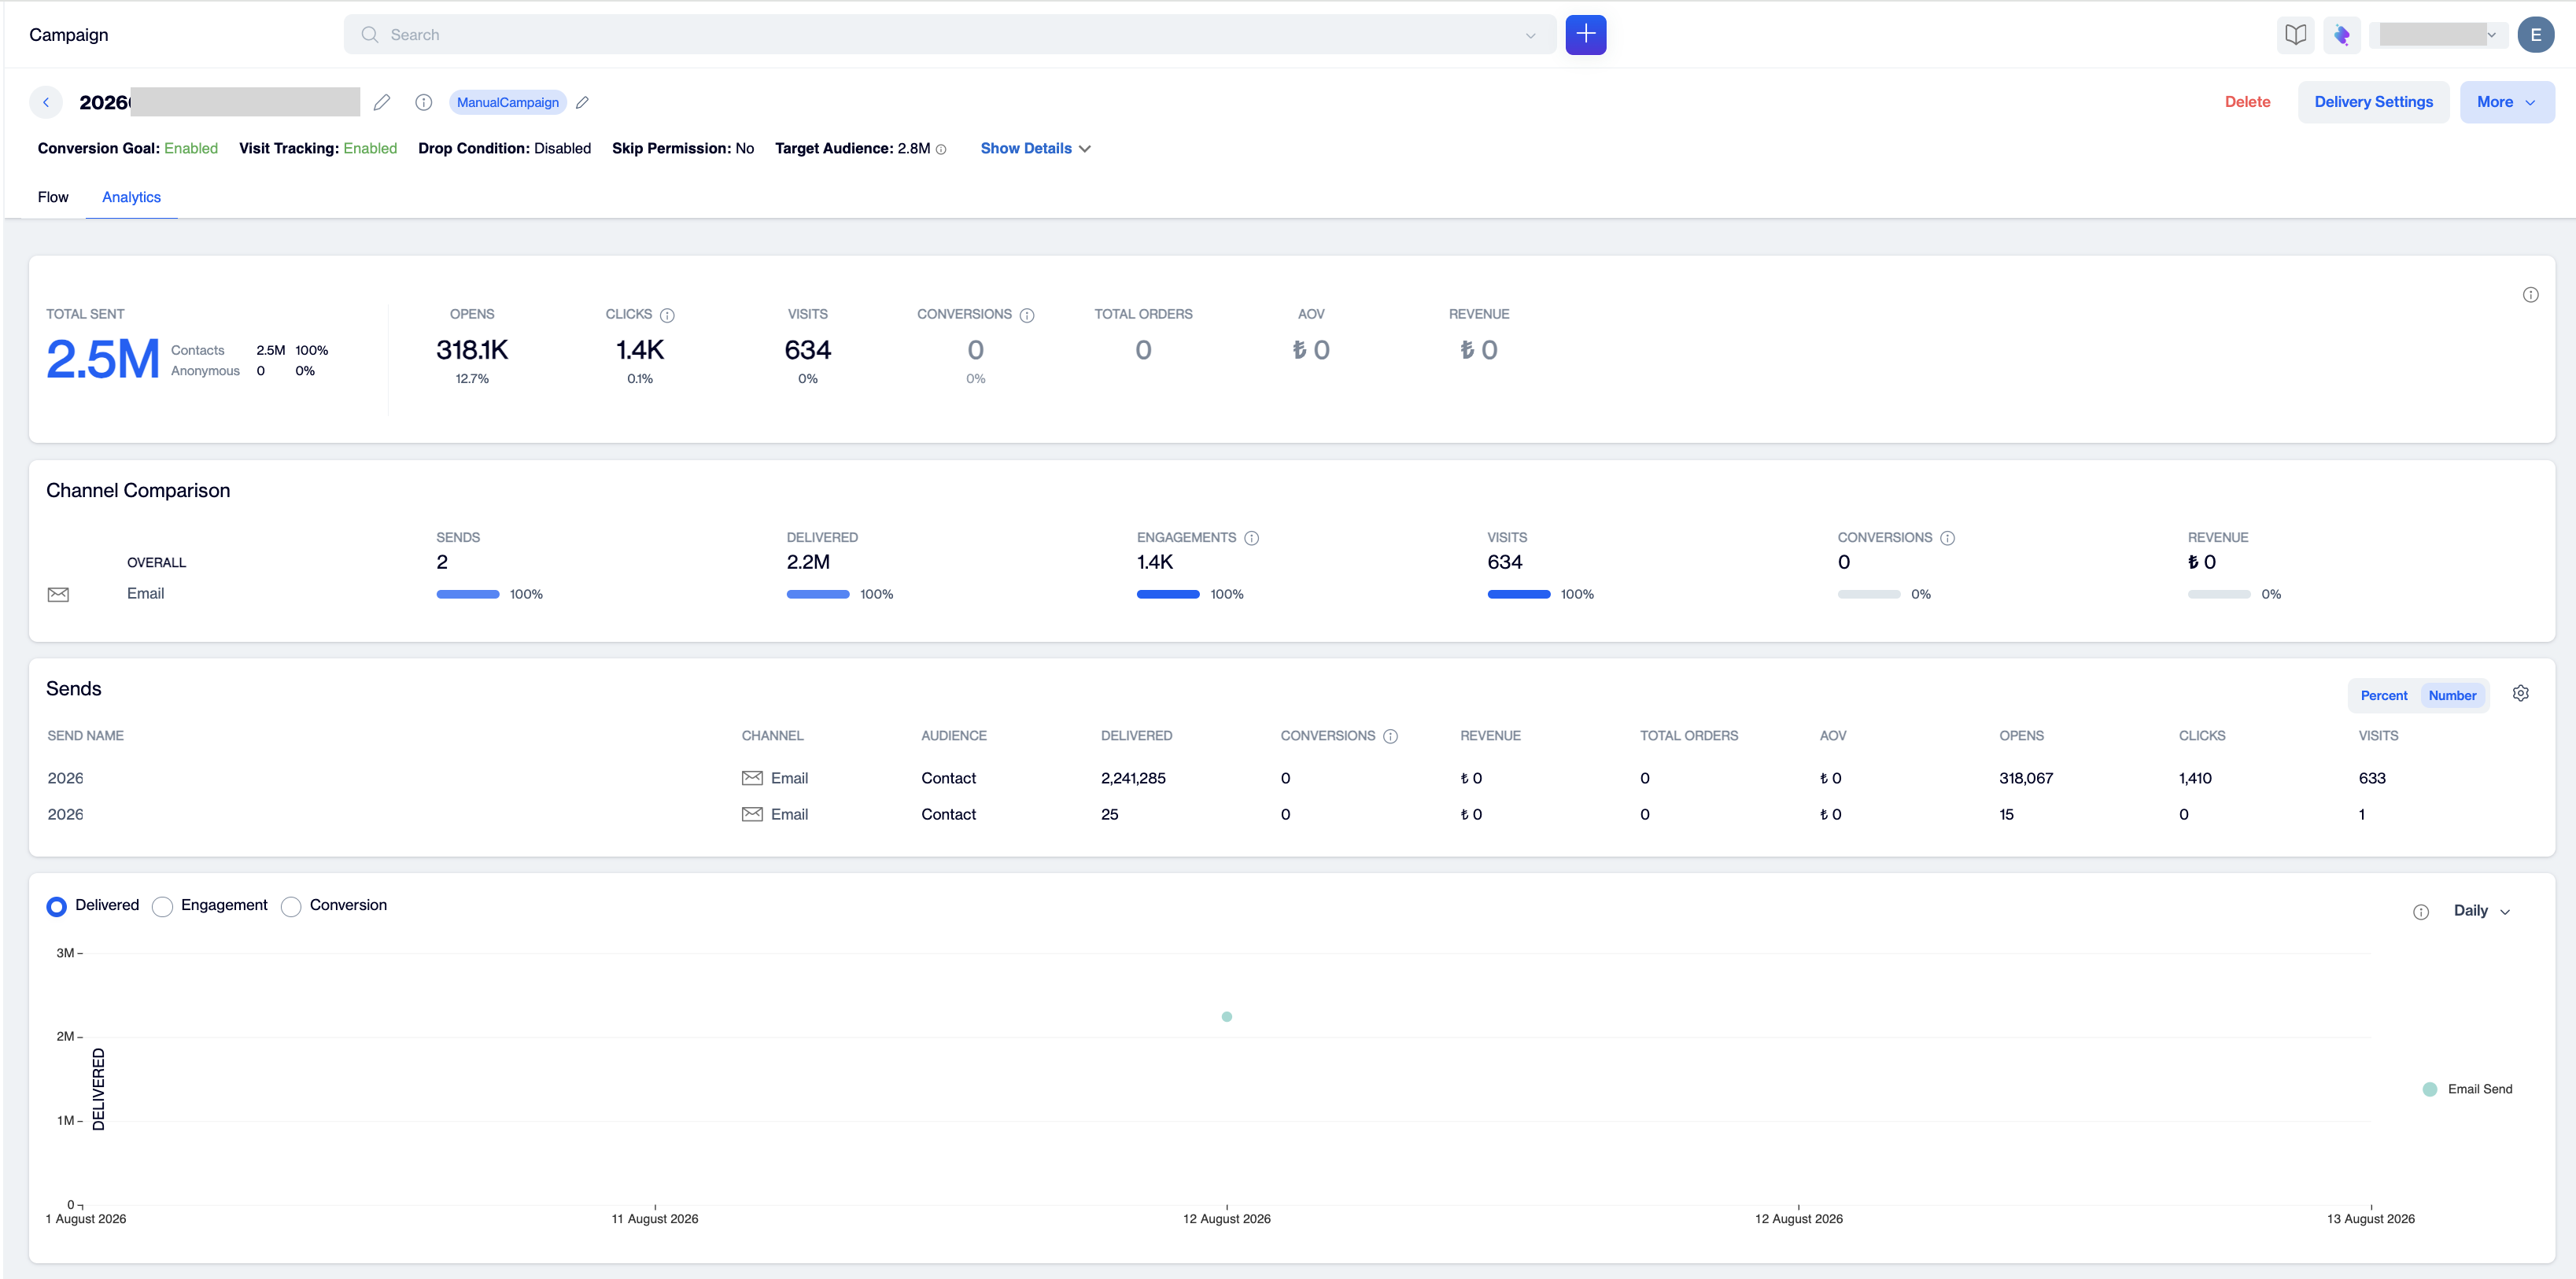
Campaign Analytics tab
The Analytics tab stops at campaign level numbers. To see what recipients did with one email, open its detailed report.
2. Email Detailed Report
How to Access
From the campaign flow:
- Open your campaign. It opens on the Flow tab.
- Click the Email node. A summary popover opens with the template, start and end times, and the send's key counts: Sent, Delivered, Opens, and CTR.
- Click View report. The report opens in a new tab.
The report header displays the campaign name, the send status (for example, Completed), and Total Targeted, the number of recipients targeted by this send. The Public ID button copies the report's public ID to your clipboard for shareable report access.
A/B Split sends
When the send comes from an A/B Split node, the node summary on the Flow tab opens as the A/B Send summary. It shows each variant with its WINNER or LOSER badge and Clicks count, the Started and Ended times of the test, the Open Rate, and the Sent, Delivered, Opens, and CTR counters of the whole send. Click View report to open the detailed report.
In the detailed report, the Content Statistic panel next to the Content block on the Summary tab shows a thumbnail of each variant with its WINNER or LOSER badge and the variant's Clicks and Open counts. The other sections of the Summary tab and the Domain Distribution, Click Report, Heat Map, and Browsers and Devices tabs cover the whole send and are not split by variant. For the configuration, see the A/B Split page.
Summary Tab
The Summary tab contains the overall performance of the send:
- Content card: A preview thumbnail of the email, the From Name (sender name and address), the Subject line, and assigned Tags.
- Total Sent: The number of messages processed for this send, with an Unsent counter next to it. Click more to open the unsent breakdown: Excluded messages with their reasons (for example, Contact Status Passive, Email Duplicate, Email Status Passive, Email Permission Passive) and Has Error.
- Delivered: Successfully delivered messages and the delivery rate.
- Unique Opens: The number of people who opened, with the open rate and the Total / Unique split. The card's info icon notes that the value represents unique users who opened the campaign, calculated based on the data from the last 1 week.
- Unique Clicks: The number of people who clicked, with the click rate and the Total / Unique split.
- Bounces: Undeliverable messages, split into Soft (temporary issues such as a full mailbox) and Hard (permanent issues such as an invalid address).
- Complaints: Unsubscribe and Spam counts with their percentages.
- Opens By Device: A donut chart that splits opens across Mobile Phone, Tablet, Desktop, and Unknown devices.
- Email Send Performance: A funnel from Delivered to Unique Opens to Unique Clicks, with the Delivery Rate, the Open Rate, and the Click To Open Rate (CTOR), the share of openers who clicked.
- Key Stats: The Top Domain, Top Device Category, Top Operating System, and Top Browser for this send.
- Visit / Conversions / Total Orders / Revenue: Site visits, conversions, orders, and revenue attributed to the campaign. These cards appear when Visit Tracking or a Conversion Goal is enabled for the campaign.
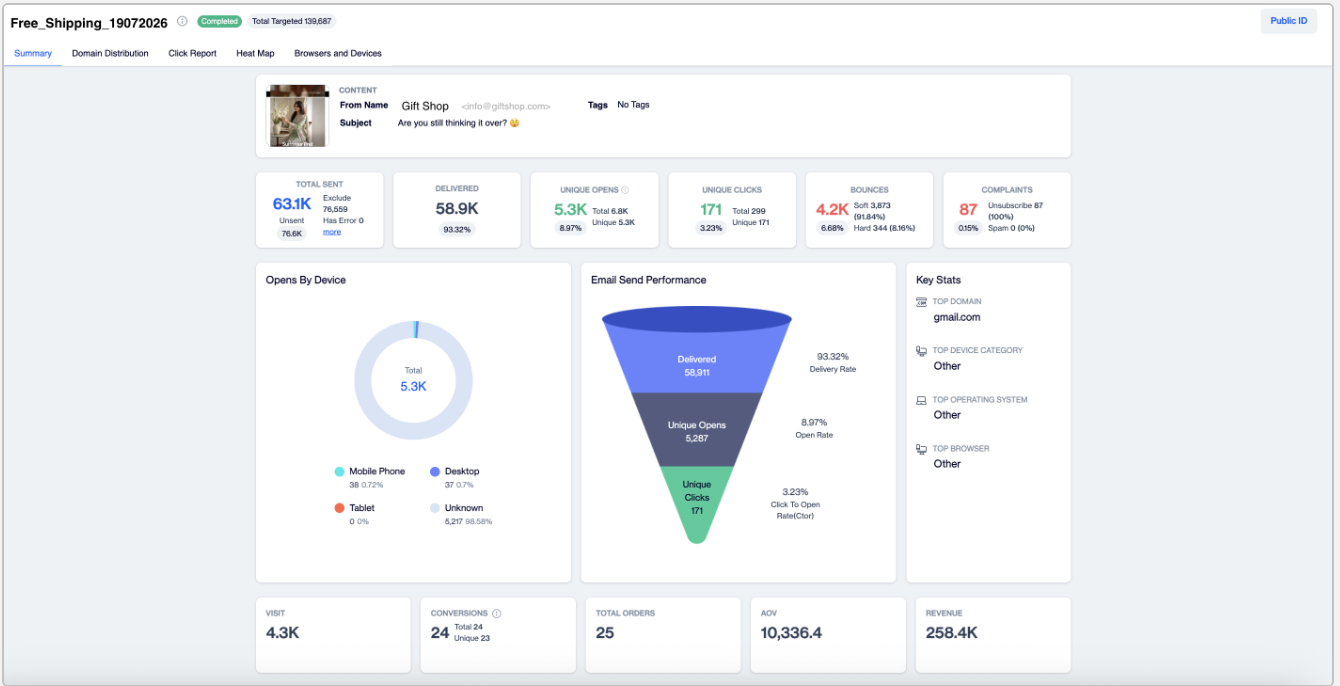
Summary tab — delivery, engagement, and conversion overview for one email send
Domain Distribution Tab
Breaks the send down by recipient email domain (gmail.com, hotmail.com, and so on) so you can spot provider specific delivery or engagement issues. It has two sub-views whose difference is the calculation base:
- Delivery Insights focuses on the performance of delivered messages for each domain. Metrics in this view are calculated based only on delivered messages.
- Domain Summary provides an overview of the overall performance of all sent messages. Metrics in this view are calculated based on the proportion of total sends across all domains.
Use Download at the top right to export the table. The last row shows the TOTAL across all domains.
| Column | Description |
|---|---|
| Domain Name | Recipient email domain (for example, gmail.com). |
| Send | Messages sent to this domain. |
| Delivered / Delivered % | Messages delivered to this domain, count and rate. |
| Unique Open / Unique Open % | Unique opens in this domain, count and rate. |
| Unique Click / Unique Click % | Unique clicks in this domain, count and rate. |
| Unique Bounce / Bounce Rate % | Unique bounces from this domain and the bounce rate. |
| Unique Complaints / Complaint Rate % | Unique complaints from this domain and the complaint rate. |
TipA bounce or complaint rate that is noticeably higher at one provider may indicate a sender reputation issue with that provider.
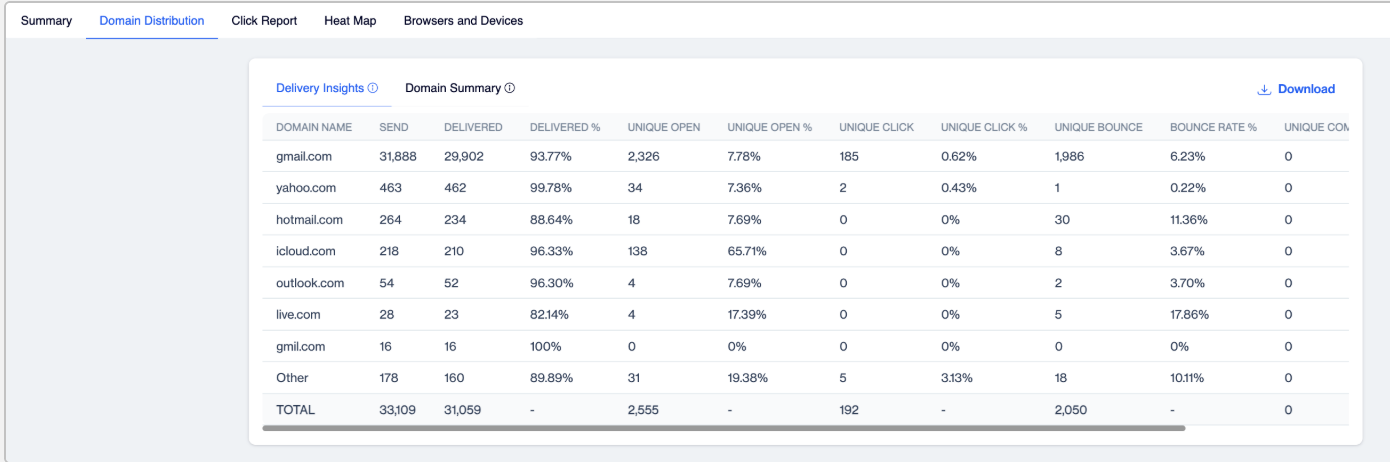
Domain Distribution tab — delivery and engagement rates per email provider
Click Report Tab
Shows the click performance of every individual link in the email, so you can see at link level which content attracted interest.
- People Clicked: People who clicked at least one link.
- Total Clicks: All clicks across all links.
- Clicks Per Person: Average clicks per clicker (Total Clicks / People Clicked).
- Didn't Click: Recipients who did not click any link.
Below the cards, the links table lists each Link with its Unique Click and Total Click # counts. Links appear as their full tracked URLs, including the tracking parameters appended at send time. Use the Page view selector and the pager to move through long link lists.
Click the three dots at the end of a link row and select Edit to open the Link Edit window, where you can update the link's URL and save it.
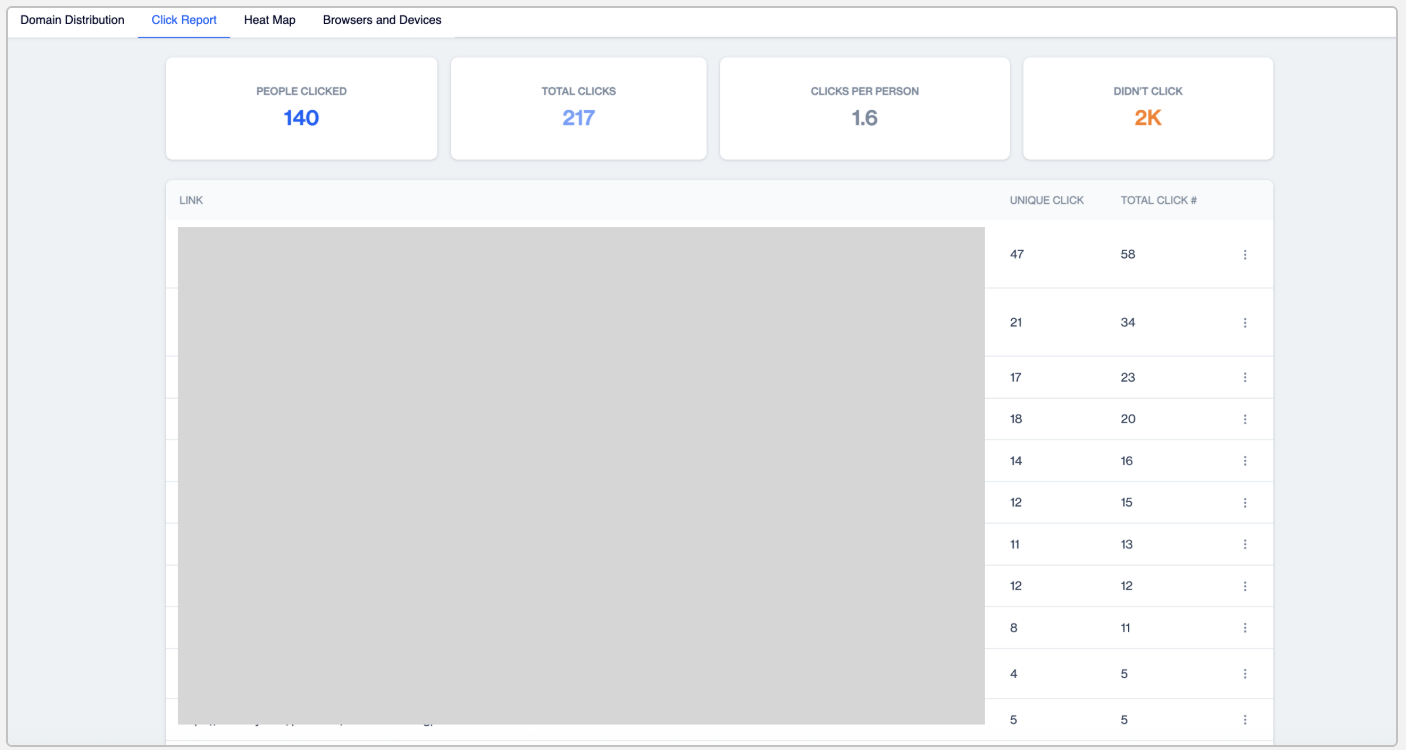
Click Report tab — click performance for each link in the email
Heat Map Tab
Overlays click density on top of your email design. Colored bubbles show where recipients clicked; the stronger the highlight, the more clicks that area received. Each clickable area, such as top menu links, the hero image, or category cards, forms its own heat zone.
If a call to action is not getting the clicks you expected, consider testing its position, size, or copy. The overlay appears once the send has click data.
Browsers and Devices Tab
Shows the technical environment of the people who opened or clicked, in four blocks: Device Type (mobile, desktop, tablet), Browser, Device (model or family), and Operating System. Each block pairs an Open Count / Click Count table with a comparison chart.
The data is generated from open and click signals. Until signals arrive, each block shows "No information found", and environments that cannot be identified are grouped under Other. As noted at the bottom of the screen, calculations are based on unique openers.
Metrics Reference Table
| Metric | Definition |
|---|---|
| Total Targeted | The number of recipients targeted by the send, shown in the report header. |
| Total Sent | Messages processed for the send. The Unsent breakdown shows Excluded messages with their reasons (passive contact status, duplicate email, passive email status, missing email permission) and Has Error. |
| Delivered / Delivery Rate | Messages accepted by the recipient server; Delivered / Total Sent. |
| Open / Unique Open | Total opens and unique opens (counted once per person). |
| Open Rate | Unique Opens / Delivered. |
| Click / Unique Click | Total clicks and unique clicks. |
| CTOR (Click To Open Rate) | Unique Clicks / Unique Opens: the share of openers who clicked. |
| Soft Bounce | Temporary delivery failure (full mailbox, busy server, and so on). |
| Hard Bounce | Permanent delivery failure (invalid or closed address). |
| Unsubscribe / Spam Complaint | Recipients who unsubscribed or marked the message as spam. |
| People Clicked / Didn't Click | People who clicked at least one link, and recipients who clicked none (Click Report tab). |
| Clicks Per Person | Total Clicks / People Clicked. |
| Conversion / Revenue | Goal actions and revenue attributed to the campaign, shown when conversion tracking is enabled. |
| Contacts / Anonymous | Registered users vs unregistered or unidentified users (campaign level Total Sent breakdown). |
Prerequisites
- The report becomes available after the send runs; open and click metrics fill in as signals arrive from recipients.
- Recurring campaigns require a Job Version and Date Range selection before generating the report.
- The Heat Map and Browsers and Devices tabs need open and click signals; Browsers and Devices calculations are based on unique openers.
- The Visit, Conversions, Total Orders, and Revenue cards require Visit Tracking or a Conversion Goal to be enabled for the campaign.
Updated about 21 hours ago