
Rest API
The REST API section provides users with detailed logs of API requests and responses. This functionality enables users to monitor and analyze REST API interactions effectively.
Upon accessing this section, the system displays the following columns:
- Request Time: The timestamp when the request was made.
- Response Time: The timestamp when the response was received.
- Username: The user who made the request.
- Transaction ID: A unique identifier for the transaction.
- Event Name: The name of the event associated with the request.
- IP Address: The IP address from which the request originated.
- Page URL: The URL of the page associated with the request.
- Request URL: The endpoint that was requested.
How to Use
Viewing Logs
- Navigate to Data Space > Internal Logs > REST API.
- The system will display a table with the above-mentioned columns, allowing you to view API logs.
Filtering Logs
To refine the displayed logs, apply filters:
- Search in Request:
- Enter a keyword or phrase to search within the request data.
- Transaction ID:
- Enter a specific Transaction ID to locate a particular log entry.
- Request Data:
- Select a specific date from the calendar to filter logs by the date they were created.
- Request Time Range:
- Specify a time range to filter logs based on the request time.
- Click the Apply button to update the log display based on your selected filters.
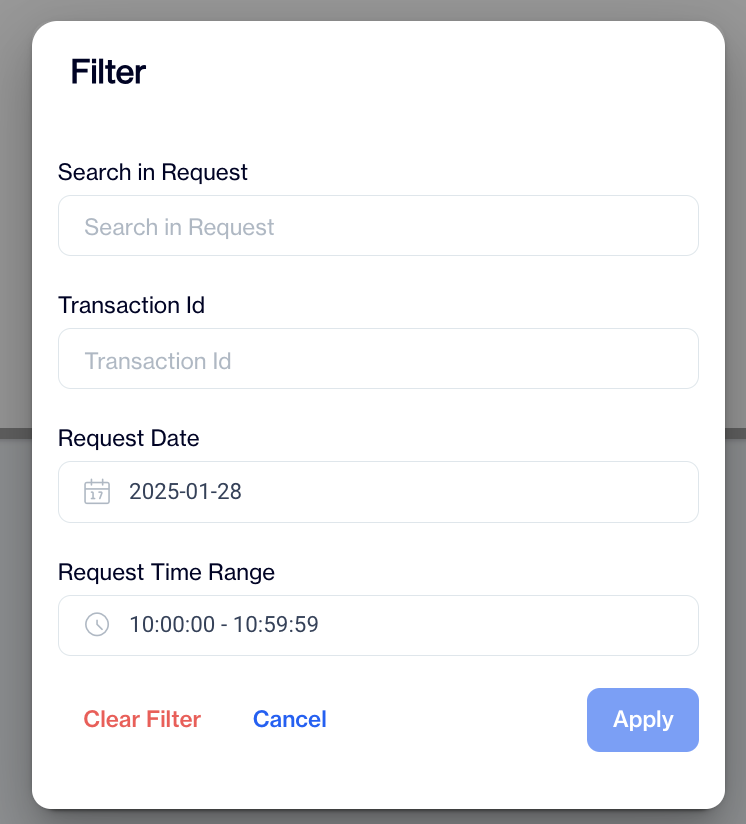
Rest API Filter
By utilizing these features, users can effectively monitor and troubleshoot REST API interactions in the system.
Updated 9 months ago
Did this page help you?