
Cohort Analysis
Cohort Analysis - by user visit
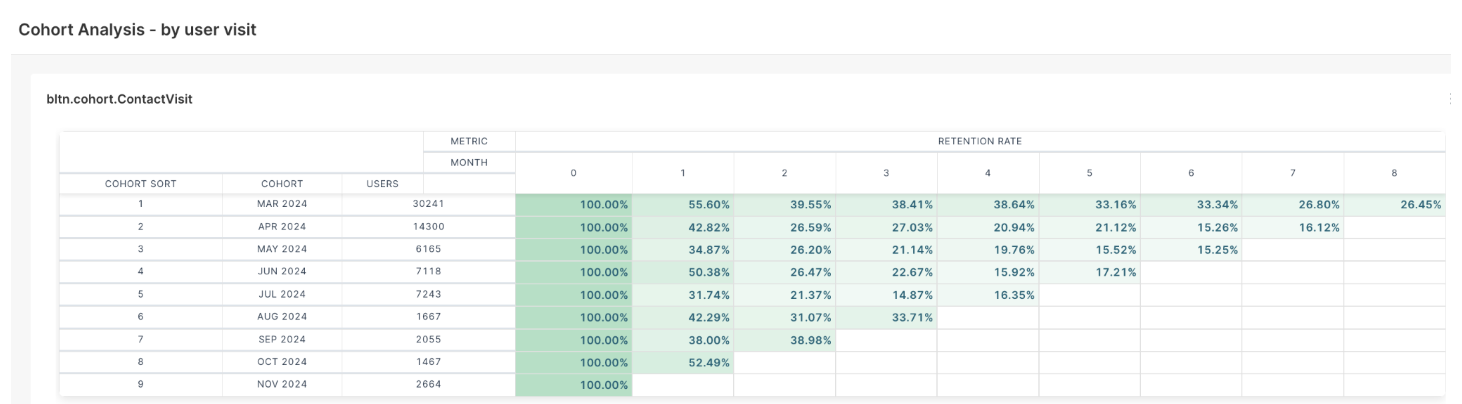
This report helps analyze how different groups of users (cohorts) engage with a system after their initial visit. The retention rate is displayed across multiple months to understand user engagement trends.
Cohort Analysis - by user visit
Understanding the Report
- Cohort: A group of users who performed their first visit in the same month.
- Users: The number of users in each cohort.
- Retention Rate: The percentage of users returning in the following months after their initial visit (Month 0 represents the starting point).
How to Read the Table:
- Each row represents a cohort, grouped by the first month users visited the platform.
- The first column shows the cohort month and year.
- The second column lists the number of users in each cohort.
- The columns labeled "0, 1, 2, 3,..." represent the months after the initial visit.
- The percentages indicate the retention rate, showing how many users returned in each subsequent month.
Cohort Analysis - by device visit
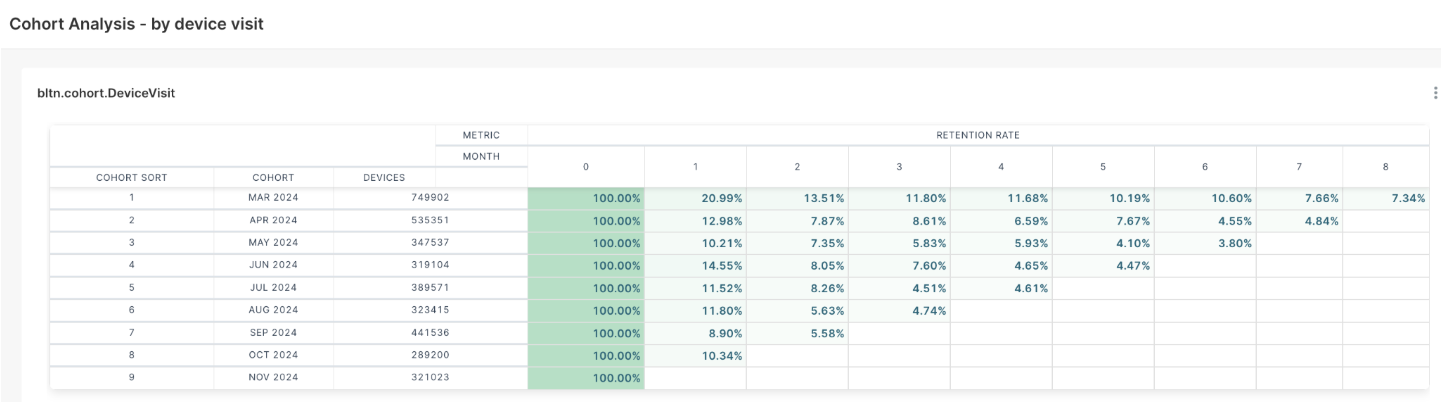
This report helps analyze how different groups of devices (cohorts) engage with a system after their initial visit. The retention rate is displayed across multiple months to understand device engagement trends.
Cohort Analysis - by device visit
Understanding the Report
- Cohort: A group of devices that accessed the system for the first time in the same month.
- Devices: The number of unique devices in each cohort.
- Retention Rate: The percentage of devices returning in the following months after their initial visit (Month 0 represents the starting point).
How to Read the Table
- Each row represents a cohort, grouped by the first month the devices visited the platform.
- The first column shows the cohort month and year, indicating when the devices were first detected.
- The second column lists the number of devices in each cohort.
- The columns labeled "0, 1, 2, 3,..." represent the months after the initial visit.
- The percentages indicate the retention rate, showing how many devices returned in each subsequent month.
Updated 10 months ago
Did this page help you?