
In-App Channel Report
The Channel Report page helps you track and analyze the performance of your In-App campaigns. Follow the steps below to access and navigate the report.
1: Access the Channel Report
- Go to the Analytics section on the main page.
- Click Report > Flow > Channel Report.
2: Understand the Top Section of the Report
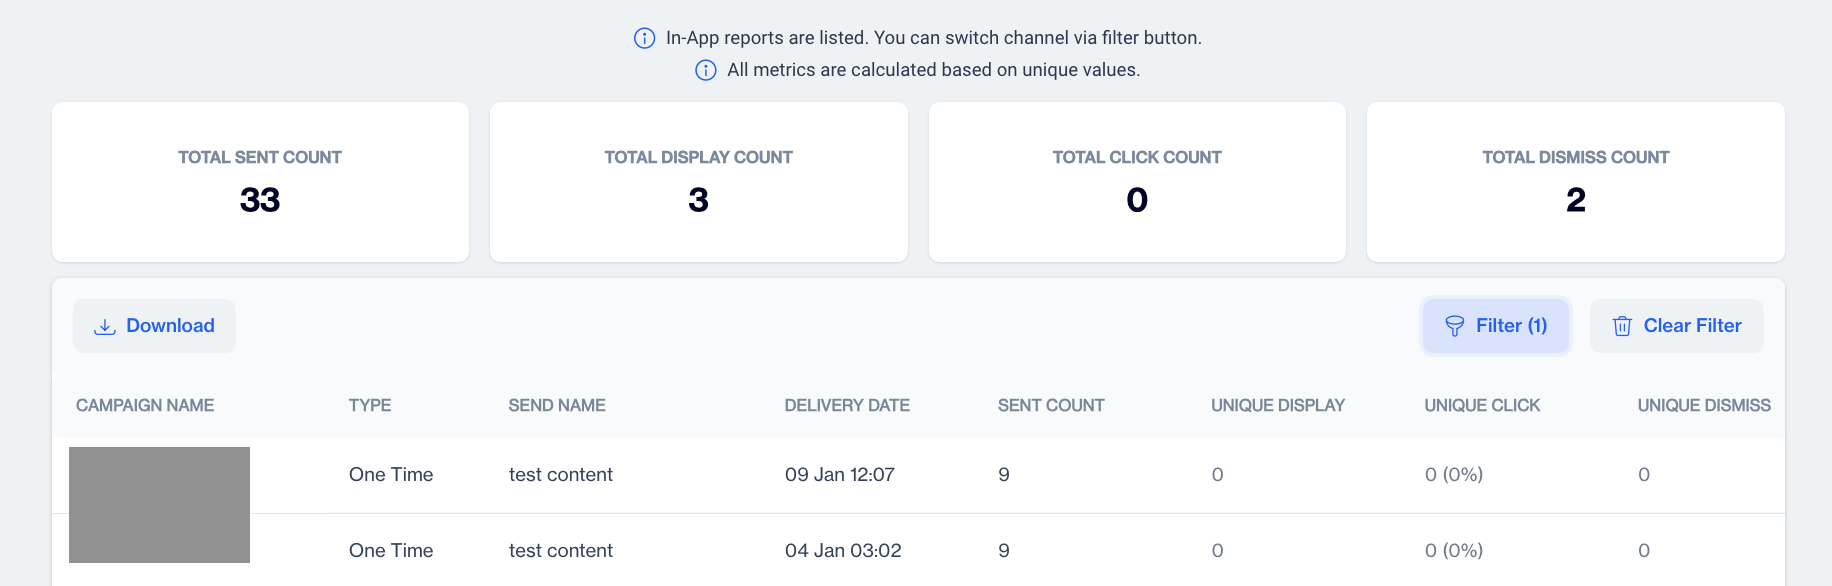
When you first arrive at the Channel Report page, the default view displays Email reports. To switch to the in-app report, click on the Filter button and choose In-App as the channel. All metrics shown in the report are based on unique values for the selected channel.
In-App Metrics
3: Review Overall Metrics
Just below this message, you will see a summary of key metrics for all your in-app campaigns:
- Total Sent Count: The total number of in-app messages sent.
- Total Display Count: The total number of times your in-app has been opened.
- Total Click Count: The total number of clicks on links within in-app messages.
- Total Dismiss Count: The number of in-app messages that have been ignored.
4: View Campaign-Specific Details
Below the summary metrics, there is a detailed table for each in-app campaign. Here’s what each column represents:
- Campaign Name: The name of the in-app campaign.
- Type: Whether the campaign is a one-time or recurring campaign.
- Send Name: The sender’s name used for the campaign.
- Delivery Date: The date the in-app campaign was sent.
- Sent Count: The number of times the in-app message was sent..
- Unique Display: The number of unique displays generated from the in-app campaign.
- Unique Click: The number of unique clicks generated from the in-app campaign.
- Unique Dismiss: The number of unique dismisses resulting from the in-app message ignorance.
- Conversion: The number of conversions resulting from the in-app.
- Revenue: The total revenue generated from the in-app campaign.
- Tag: Tags applied to categorize the campaign.
5: View Campaign Reports
If you want to dive deeper into a specific campaign’s performance:
- Double-click on the Campaign Name in the table.
- You will be directed to a Send Details page for that specific in-app campaign, where you can see more in-depth metrics.
Send Details/Campaign Performance Details
This page provides a detailed breakdown of your in-app campaign's performance.
In-App Send Details
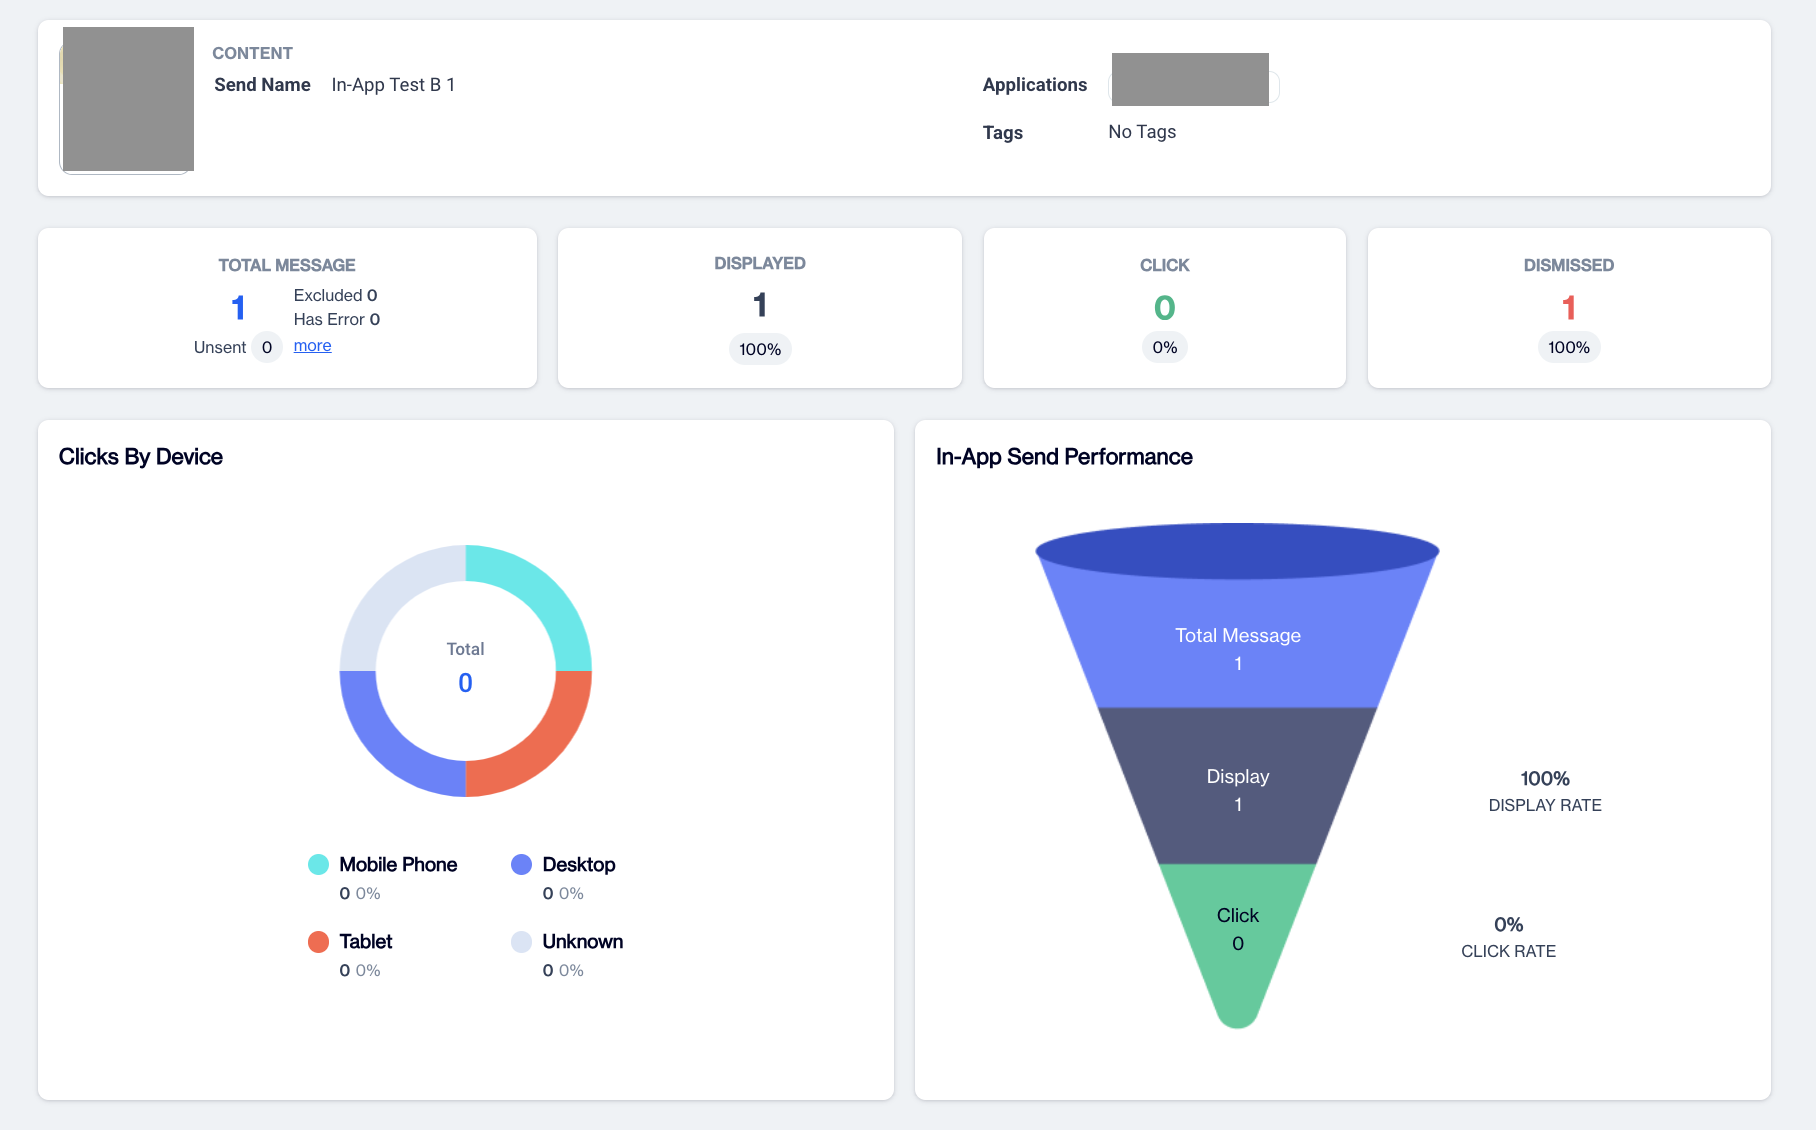
In the Content section you'll find key information related to the content of your in-app campaign:
- Send Name: The name of the selected in-app campaign.
- Application: The application or platform that the in-app campaign is displayed.
- Tags: Any tags or labels associated with the campaign, used for categorization and tracking.
Metrics section provides key performance statistics for your in-app campaign:
Total Messages: Total number of in-app messages sent. In the Total Messages section, you’ll also find a breakdown of why certain in-app messages were not sent. These include:
- Excluded: In-app messages that were excluded based on predefined rules or audience filters.
- Error: The number of In-app message delivery failures due to errors.
Displayed: The number and percentage of successfully displayed in-app messages.
Clicks: The percentage and number of recipients who clicked on links in the in-app messages.
Dismissed: The percentage and number of in-app messages that were dismissed.
Clicks By Device
The Click By Device section provides an overview of your on-site campaign's click performance based on different devices. Here are the available devices depicted on the circular chart:
- Mobile Phone
- Desktop
- Tablet
- Unknown
This section helps you track the delivery success rate of your campaign and identify issues such as failed deliveries or pending messages.
In-App Send Performance
Next to the Clicks by Device graphic, the In-App Send Performance cone chart presents key metrics, including:
- Total Message: The total number of messages sent targeted for the in-app campaign.
- Display: The total number and percentage of displays as a result of in-app messages.
- Click: The total number and percentage of clicks as a result of in-app messages.
Below, you can see the number of visits, conversions (includes total and unique conversion), total number of orders and overall revenue resulting from the selected in-app campaign.
Updated 1 day ago