
Audience Insights
Audience Insights includes the Contacts, Device, and Inspector sections. A date filter can be applied to refine the results.
Contacts
This section provides a detailed overview of contact data analytics, offering valuable insights into the performance and engagement of a business's contact database. Key metrics at the top summarize critical information, including the following stats sections:
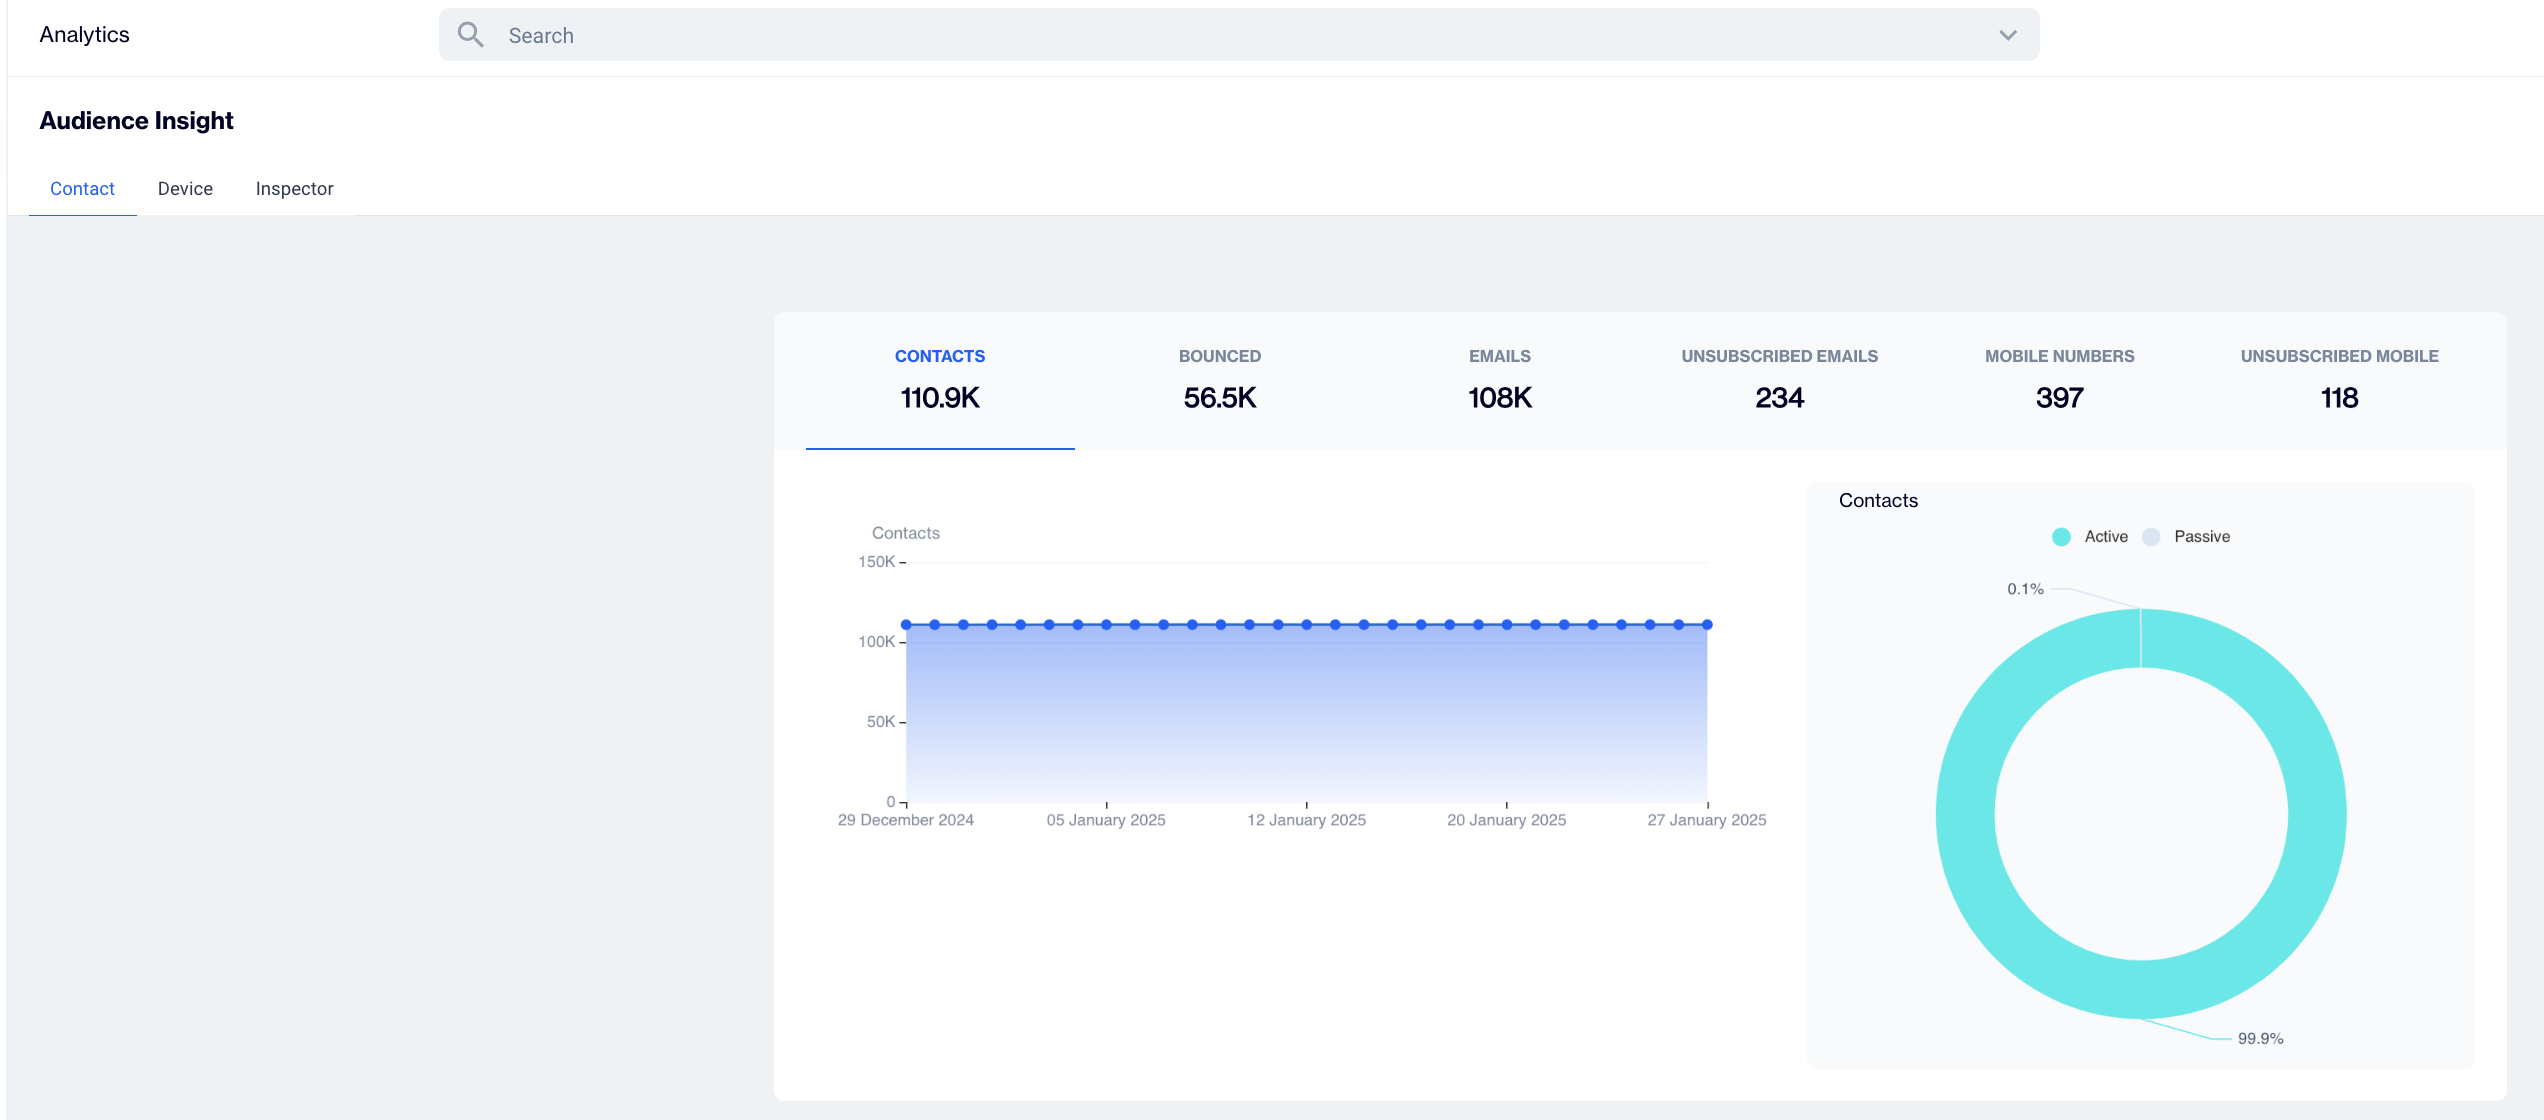
Contacts
- Contacts: In a donut chart, this section displays contact statistics, a line graph illustrating contact trends, and Active/Passive status.
- Bounced: The Bounced stats section displays a line graph and a donut chart representing Hard Bounce and Soft Bounce data.
- Emails: This stat displays the number of emails and breaks down active and passive emails.
- Unsubscribed Emails: This section displays the number of unsubscribed emails.
- Mobile Numbers: This stat displays the number of mobile numbers and the breakdown of active and passive mobile numbers.
- Unsubscribed Mobile Numbers: This stat shows the number of mobile numbers and the breakdown of active and passive mobile numbers.
Device
The device section displays stats for valid tokens, reachable tokens, anonymous tokens, and authenticated tokens.
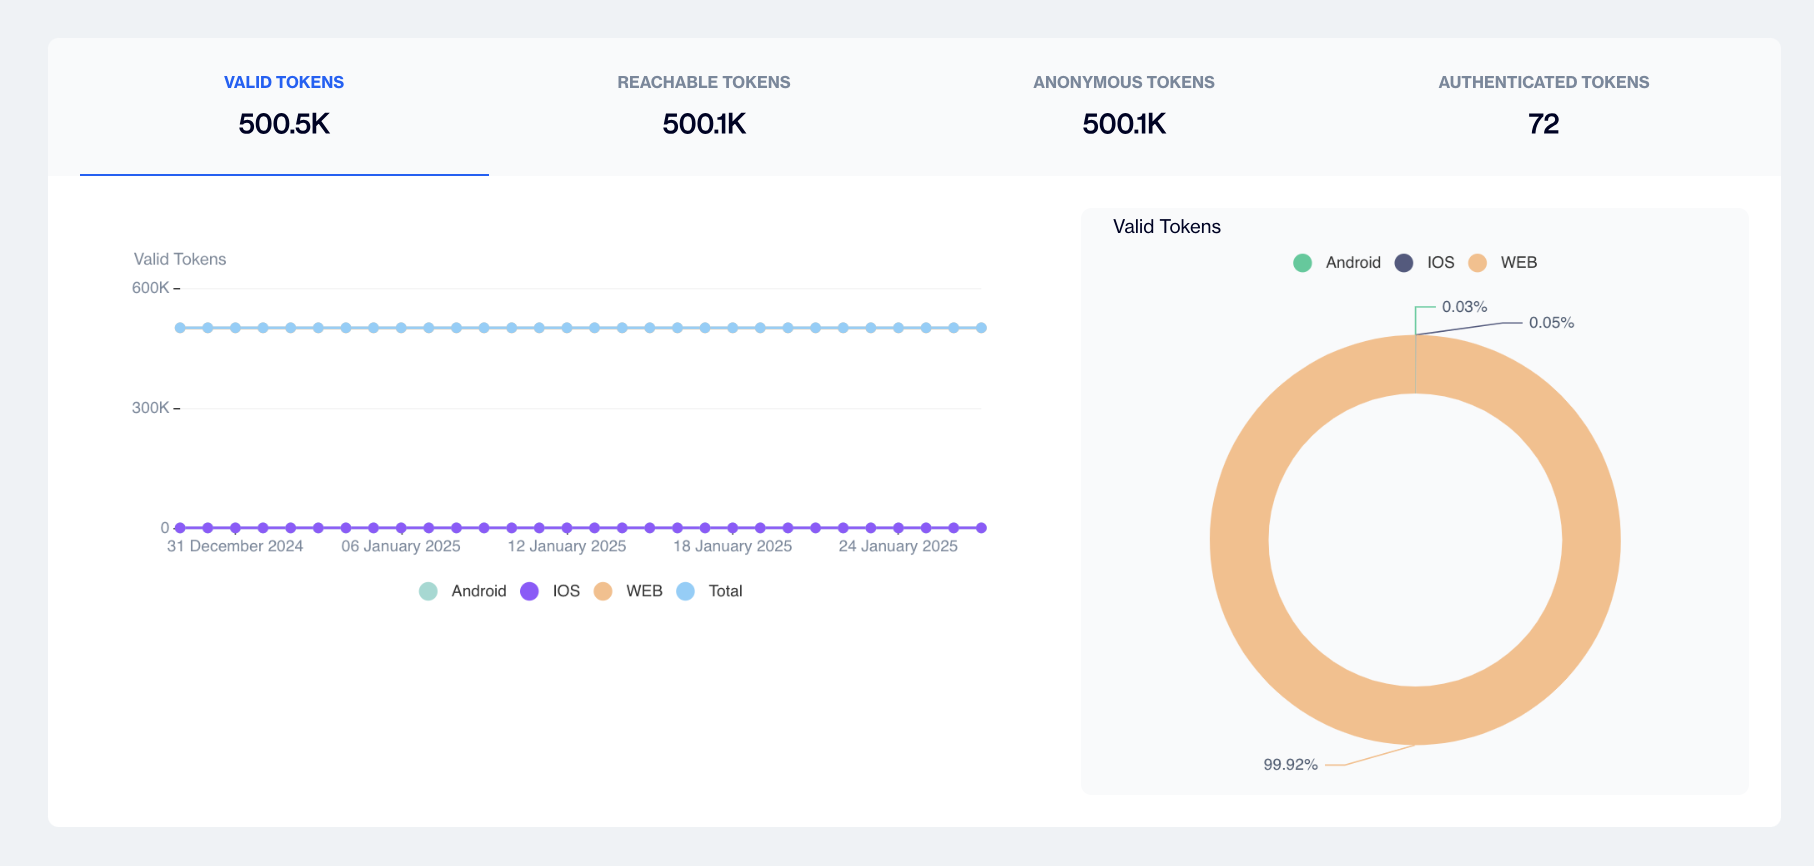
Device
- Valid Tokens: This section displays date-wise valid tokens for Android, iOS, and the web on a point graph, with overall percentages shown on a donut graph.
- Reachable Tokens: This section presents date-wise reachable tokens for Android, iOS, and the web on a point graph, with overall percentages displayed on a donut graph.
- Anonyms Tokens: This section shows date-wise anonymous tokens for Android, iOS, and the web on a point graph, with overall percentages visualized on a donut graph.
- Authenticated Tokens: This section highlights date-wise authenticated tokens for Android, iOS, and the web on a point graph, with overall percentages on a donut graph.
Inspector
The graph displays the data generated only after the tracking of the corresponding table is started. No prior data is displayed. The inspector section shows the row count of the following:
- Demo Air - Search Abandoner
- Demo Air - Customer with flight in 5 days
- SC - New Customer Onboarding
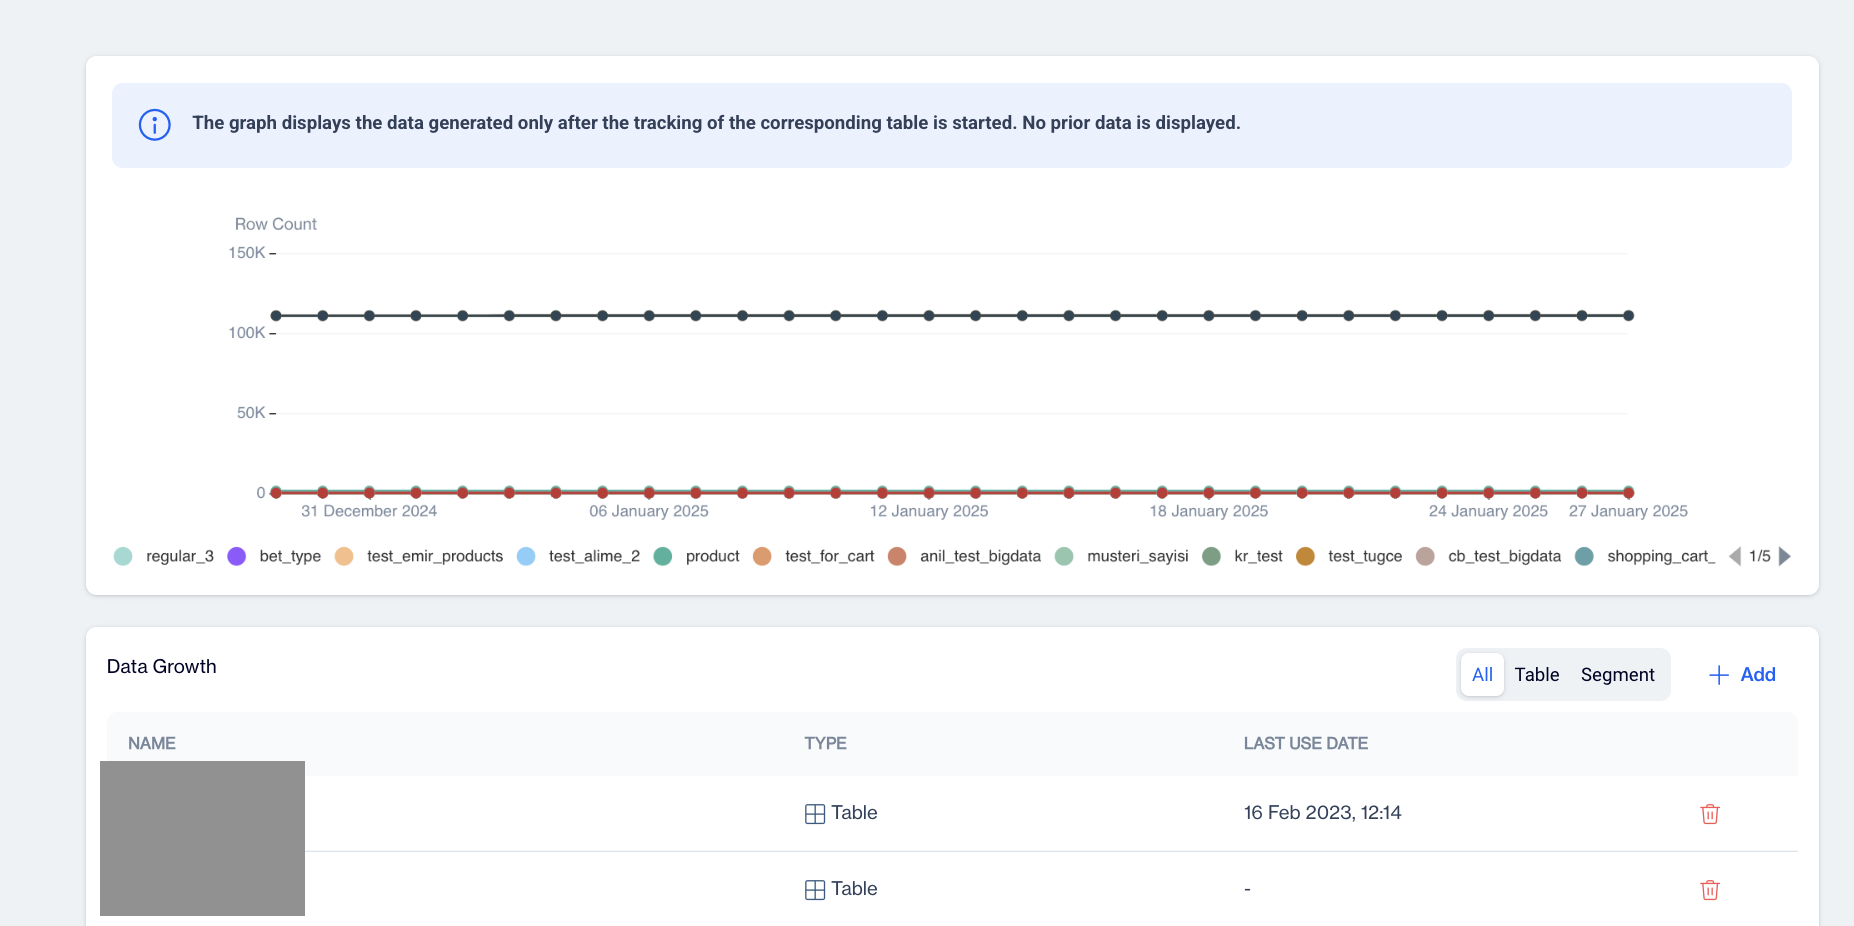
Inspector
Data Growth
The system displays three tabs: All, Table, and Segment. The listing columns include: Name, Type, Last User Date, and Delete.
- Add New Table/Segment: This option can add new data growth.
- Click on the “Add” button
- Select or search for any table or segment. You can also apply filters on the tables or segments.
- Remove: Click the delete button for any specific table or segment. A confirmation pop-up appears with the message, “Sure to delete this item?” with the Cancel and Ok buttons.
Updated 1 day ago