
Push Detailed Report
To access the Detailed Report in the Analytics section, navigate to Campaign > Flows and click on your campaign name to view the report. Alternatively, you can click on the three dots at the end of the campaign row and select Flow/Analytics to open the detailed report and analyze the campaign's performance metrics.
To view reports for recurring campaigns, you first need to select the "Job Version" and set the "Date Range". After making these selections, press the "Report" button to generate and view the campaign reports.
Push Detailed Report
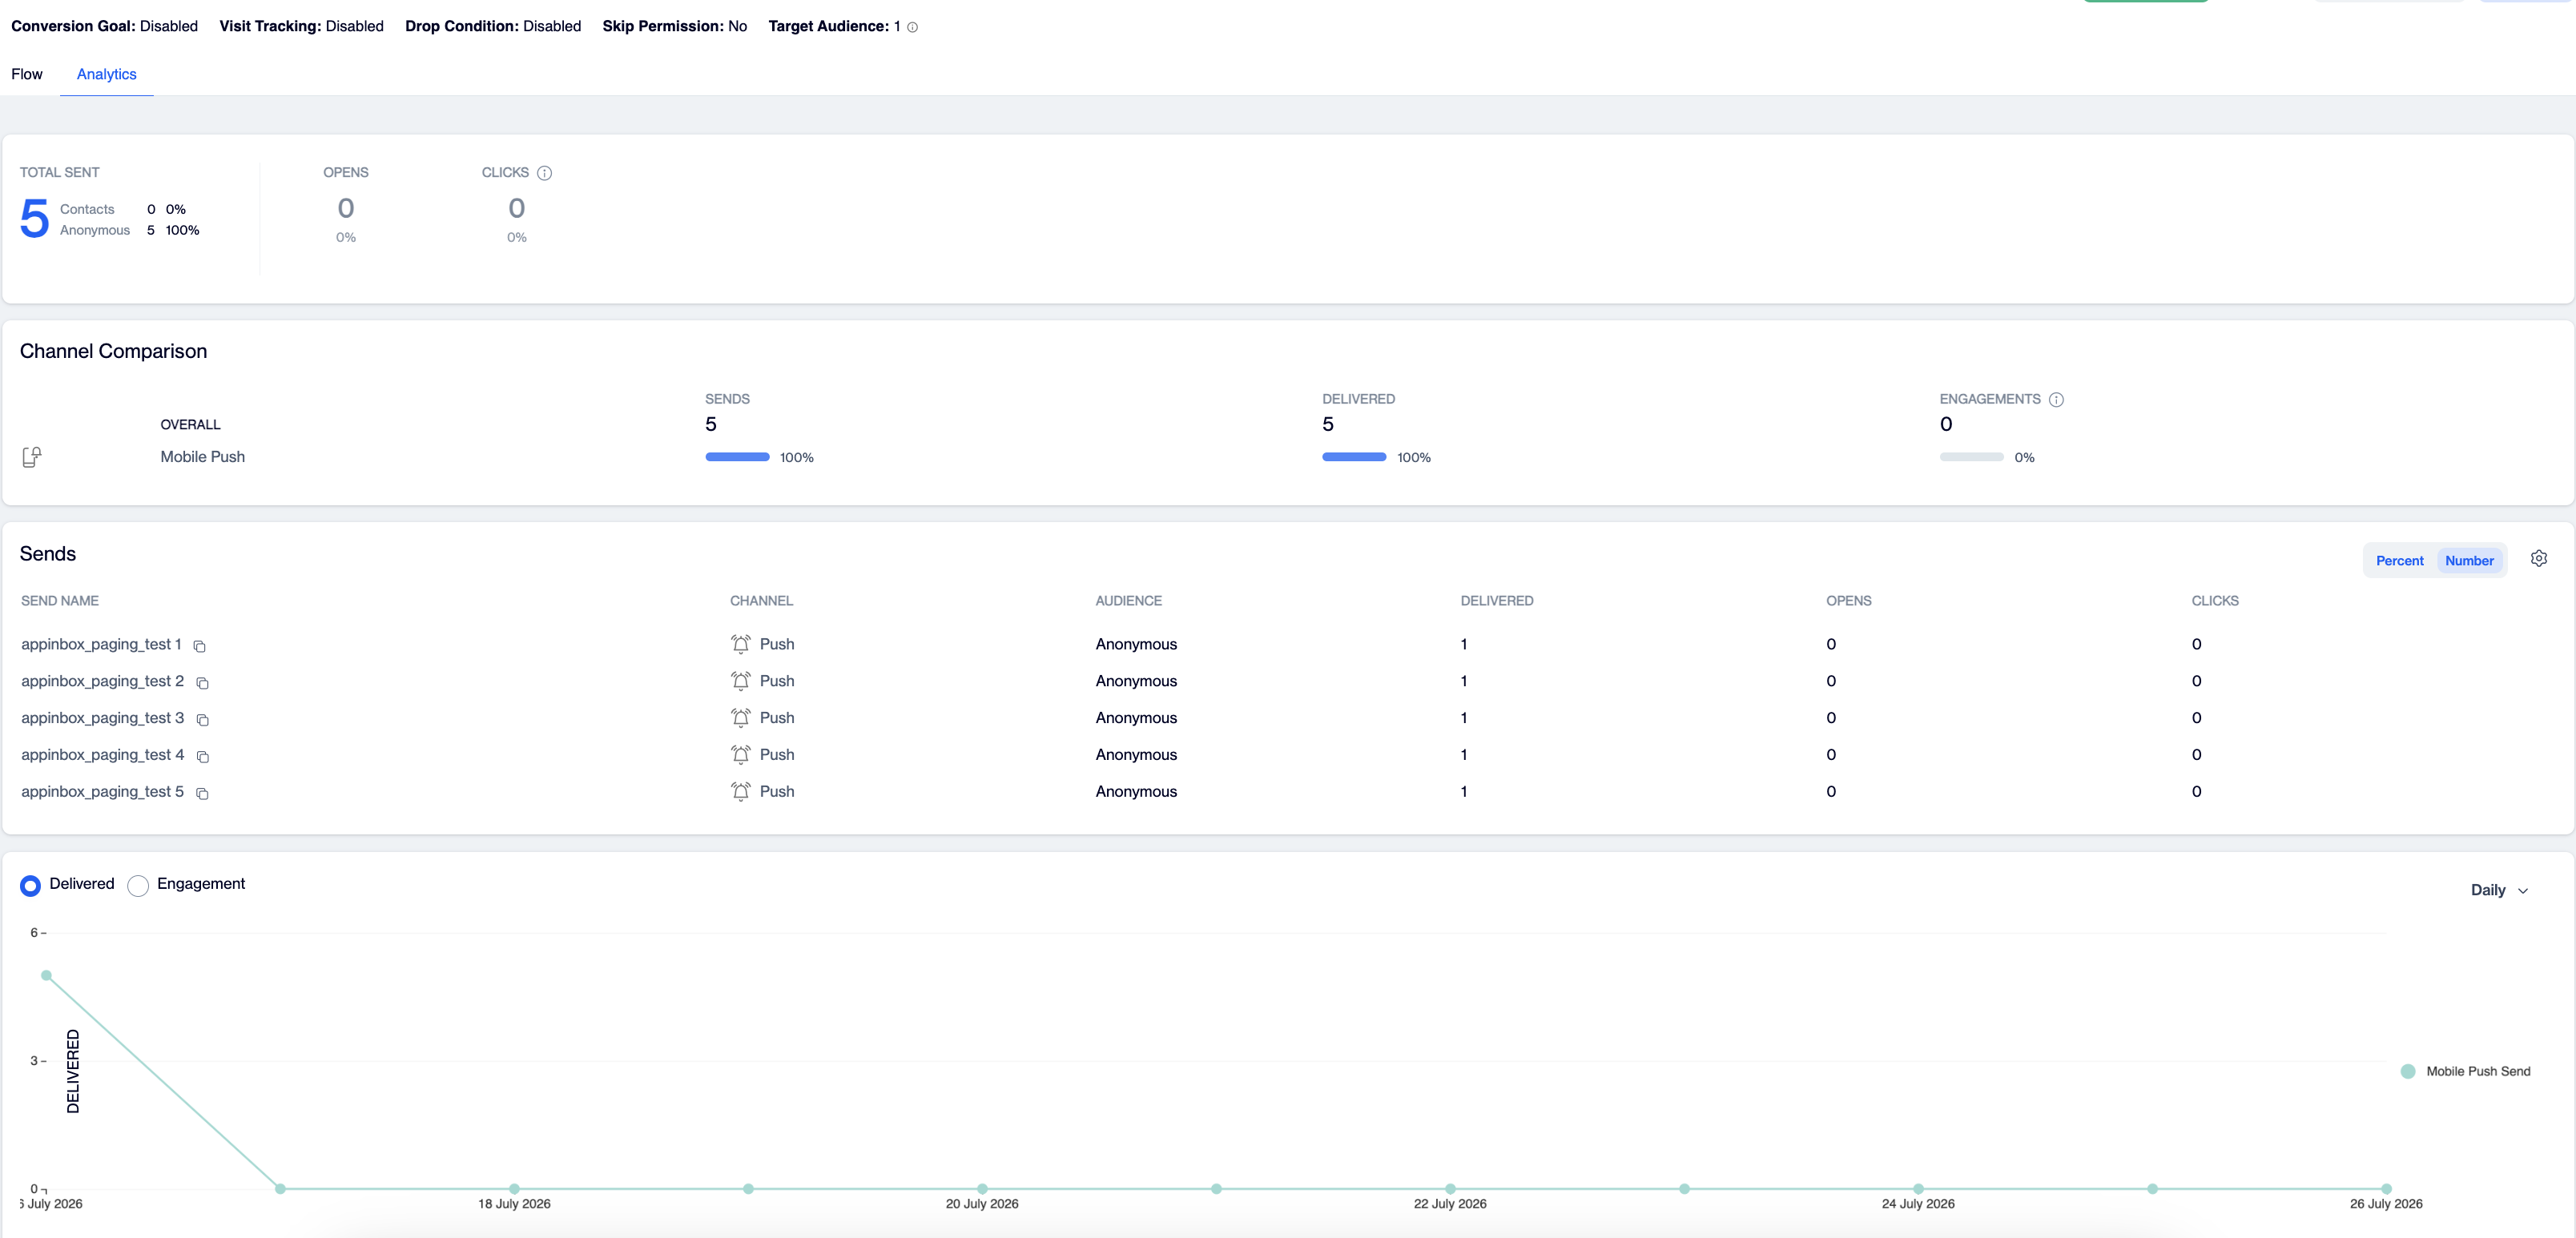
In the Detailed Report section, you'll find the following metrics:
- Total Send: This is broken down into two categories — Contacts (registered users) and Anonymous (unregistered or unidentified users).
- Opens: Displays the number of times the push notification was opened, along with the percentage of recipients who opened it.
- Clicks: Shows the number of times recipients uniquely clicked on links within the message, along with the corresponding percentage.
In the Channel Comparison section of the Detailed Report, you'll see metrics that compare the performance across different channels. This includes:
- Sends: The total number of messages sent for each channel.
- Delivered: The number and percentage of successfully delivered messages.
- Engagement: The number and percentage of interactions (total clicks) with the messages across each channel.
This section helps you evaluate how different channels are performing in terms of reach and engagement.
In the Sends section of the Detailed Report, you'll find the following columns, where you can choose to display data as either percentages or numbers:
- Send Name: The name of the specific send.
- Channel: The communication channel used (e.g., email, SMS, push notification).
- Status: The current status of the send.
- Audience:: Indicates whether the audience consists of Contact or Anonymous.
- Delivered: The number or percentage of successfully delivered messages.
- Opens: The number or percentage of messages opened.
- Clicks: The number or percentage of links clicked within the message.
This section provides a detailed breakdown of each send's performance.
At the bottom of the screen, there is a graphic chart that allows you to view campaign performance. You can toggle between daily, weekly, or monthly views, and choose to display data for either Delivered messages or Engagement metrics.
Updated 1 day ago