
A Smarter Way to Track, Report, and Analyze: Introducing the D•engage Advanced Analytics
At D•engage, we know that data-driven decisions are at the heart of successful marketing. That’s why we’ve redesigned our reporting and analytics tools to give you more flexibility, deeper insights, and easier customization. The new experience helps you focus on tracking what matters most while making reporting faster, clearer, and more actionable.
This update brings smarter dashboards, richer KPI tracking, customizable reports, and enhanced visualizations. Each upgrade is designed to make your data more meaningful and your decision-making more confident.
📊 Smarter Dashboards: See What Matters Most
Your dashboard is now more powerful and intuitive. You can organize insights the way you prefer and instantly highlight the information that drives action.
What’s new
-
Drag-and-drop layouts for full customization
-
Tabbed navigation for multiple views inside a single dashboard
-
Smarter filters and search to quickly surface relevant data
Build dashboards that fit your goals without the limits of one-size-fits-all views.
📈 More Metrics, More Clarity, Better Insights
Our expanded analytics engine brings a clearer view of campaign performance and audience behavior.
What’s improved
-
Detailed KPIs that highlight effectiveness and engagement
-
Time-based comparisons for spotting performance trends
-
Advanced segmentation and filtering to understand audiences better
You get a structured and detailed way to see what is working and what needs improvement.
📑 Custom Reports Without the Headaches
Reporting should adapt to your business. Now you can create reports that reflect your exact needs with full control.
What’s new
-
Flexible filtering to focus on the right data
-
Customizable metrics and dimensions tailored to your goals
-
Multiple export options for easy sharing and analysis
🔔 Advanced customization is available for select plans. Contact your success manager for details.
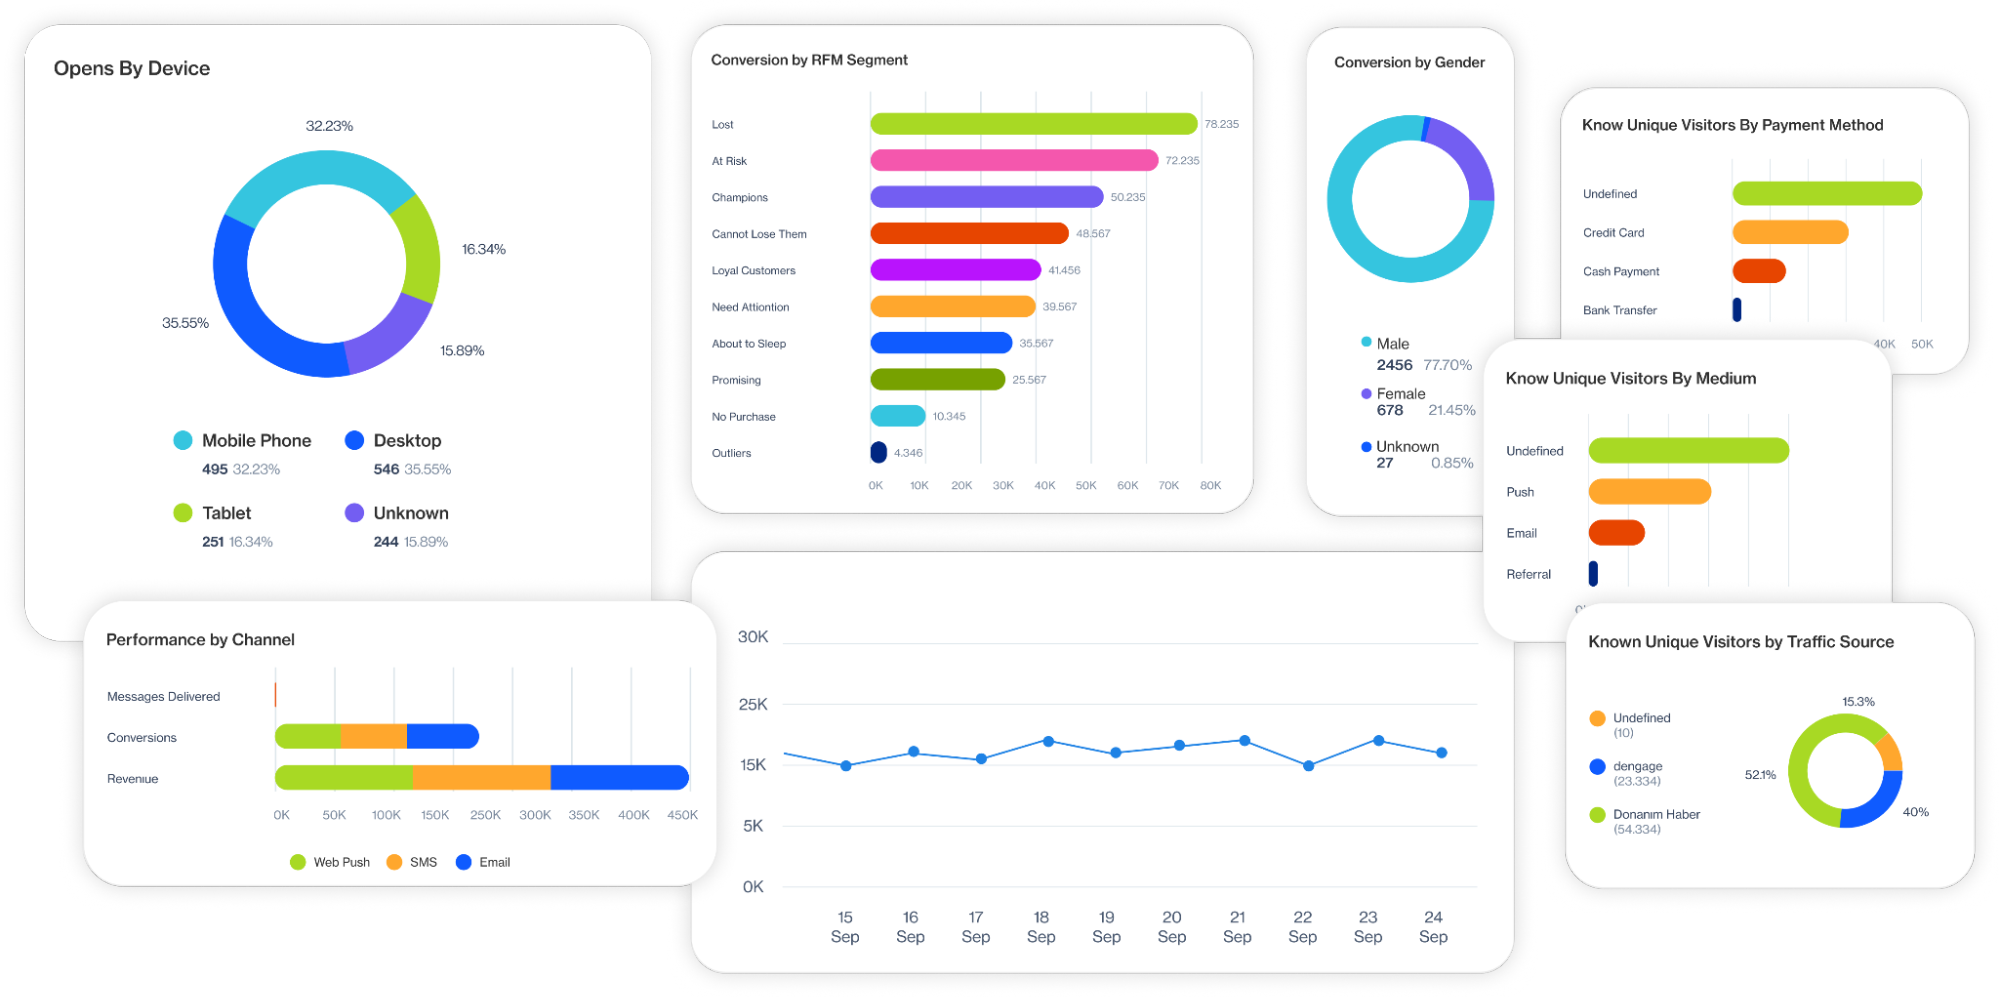
📉 Better Visualizations, Faster Decisions
Your data tells a stronger story when it is visual. The new charts and visual elements make trends easier to spot and insights easier to share.
What’s enhanced
-
More visualization types for clear storytelling
-
Custom chart settings to highlight key findings
-
Interactive, fluid experience for exploring data
With clear and engaging visuals, your insights become instantly actionable.
Visit our help guide to learn more about Advanced Analytics capabilities.
🚀 Ready to Experience the Upgrade?
The new D•engage reporting experience brings greater efficiency, sharper analysis, and more confident decision-making. If you want to try, please reach out to your customer success manager.